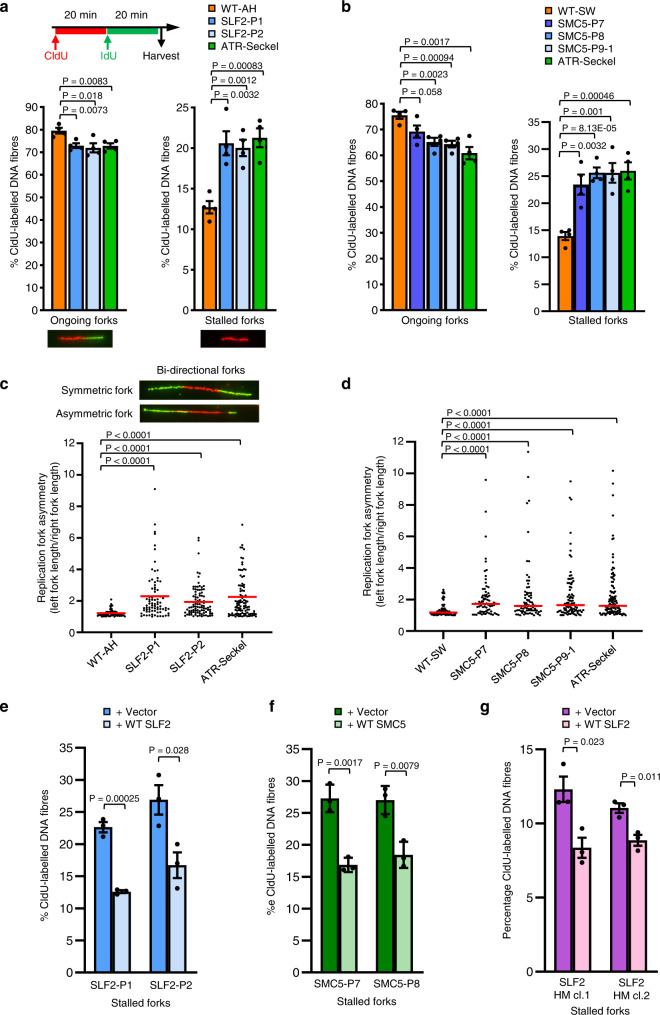
Fig. 5. Patient-derived cell lines from individuals with biallelic SLF2 or SMC5 variants exhibit increased levels of spontaneous replication fork instability.
a Top: Schematic representation for DNA fiber analysis in untreated cells. The indicated cell lines were pulse-labeled with CldU for 20 min, then pulse-labeled with IdU for 20 min. Bottom: DNA fiber analysis of SLF2 patient-derived LCLs or LCLs from a WT individual. The percentage of ongoing forks (left) or stalled forks (right) was quantified. n = 4 independent experiments. A minimum of 1500 fork structures were counted. b DNA fiber analysis of SMC5 patient-derived LCLs or WT LCLs. Quantification of the levels of ongoing forks (left) or stalled forks (right). n = 4 independent experiments. A minimum of 750 fork structures were counted. c, d Quantification of replication fork asymmetry of WT, SLF2 patient (c) or SMC5 patient LCLs (d). n = 4 independent experiments. A minimum of 75 fork structures were counted. Red lines denote median values. A Mann-Whitney rank sum test was performed for statistical analysis. Replication fork asymmetry represents the ratio of the left to right fork-track lengths of bidirectional replication forks. e, f DNA fiber analysis of SLF2 (e) and SMC5 (f) mutant fibroblast cell lines infected with lentiviruses encoding WT SLF2, WT SMC5, or an empty vector. The percentage of ongoing forks (left) or stalled forks (right) in untreated cells was quantified. A minimum of 350 fork structures in total were counted over 3 independent experiments. g DNA fiber analysis of U-2-OS SLF2 CRISPR hypomorphic (HM) cells infected with lentiviruses encoding WT SLF2 or an empty vector. The percentage of stalled forks in untreated cells was quantified. A minimum of 1000 fork structures in total were counted over 3 independent experiments. For (a, b, e, f, g); a Student’s t test (two-sided, equal variance) was performed for statistical analysis and error bars denote SEM.

