
FIGURE 6.
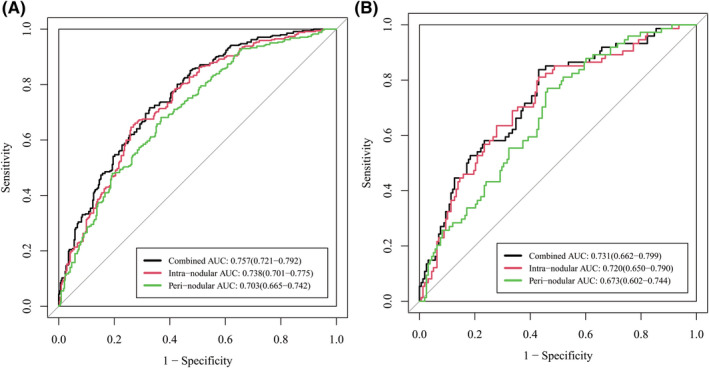
Receiver operating characteristic (ROC) curves of intra‐nodular, peri‐nodular, and combined radiomic models in the training (A) and validation (B) cohort. Data in the parentheses referred to the 95% confidence interval of area under the curve (AUC)