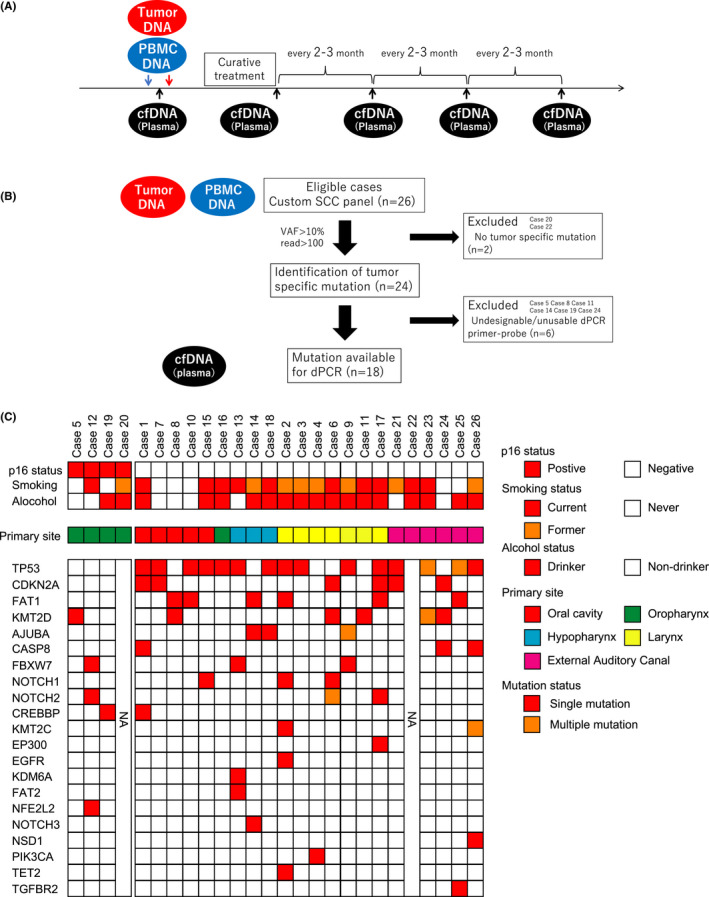
FIGURE 1.

(A) Timing of sample collection. (B) Flow chart of patient eligibility. (C) Tumor‐specific mutation identified from the tumor, and PBMC DNAs using SCC panel. p16 status, smoking, and alcohol status are shown in the top panel. The primary site is shown in the middle panel. Tumor‐specific mutations are shown in the bottom panel. Red boxes show mutated genes with VAF >10% in the primary tumor. The rows are sorted by the gene with the highest mutation frequency. PBMC, peripheral blood mononuclear cell; SCC, squamous cell carcinoma; VAF, variant allele frequency
