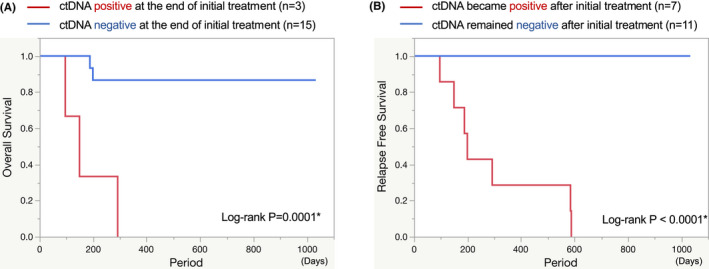
FIGURE 3.

(A) Kaplan–Meier curves showing overall survival according to ctDNA status at the end of initial curative treatment. The end of initial curative treatment means the time of the first plasma collection after the initial curative treatment. P‐value was derived from the log‐rank test. (B) Kaplan–Meier curves showing relapse‐free survival according to ctDNA status during follow‐up after initial curative treatment. p‐value was derived from the log‐rank test
