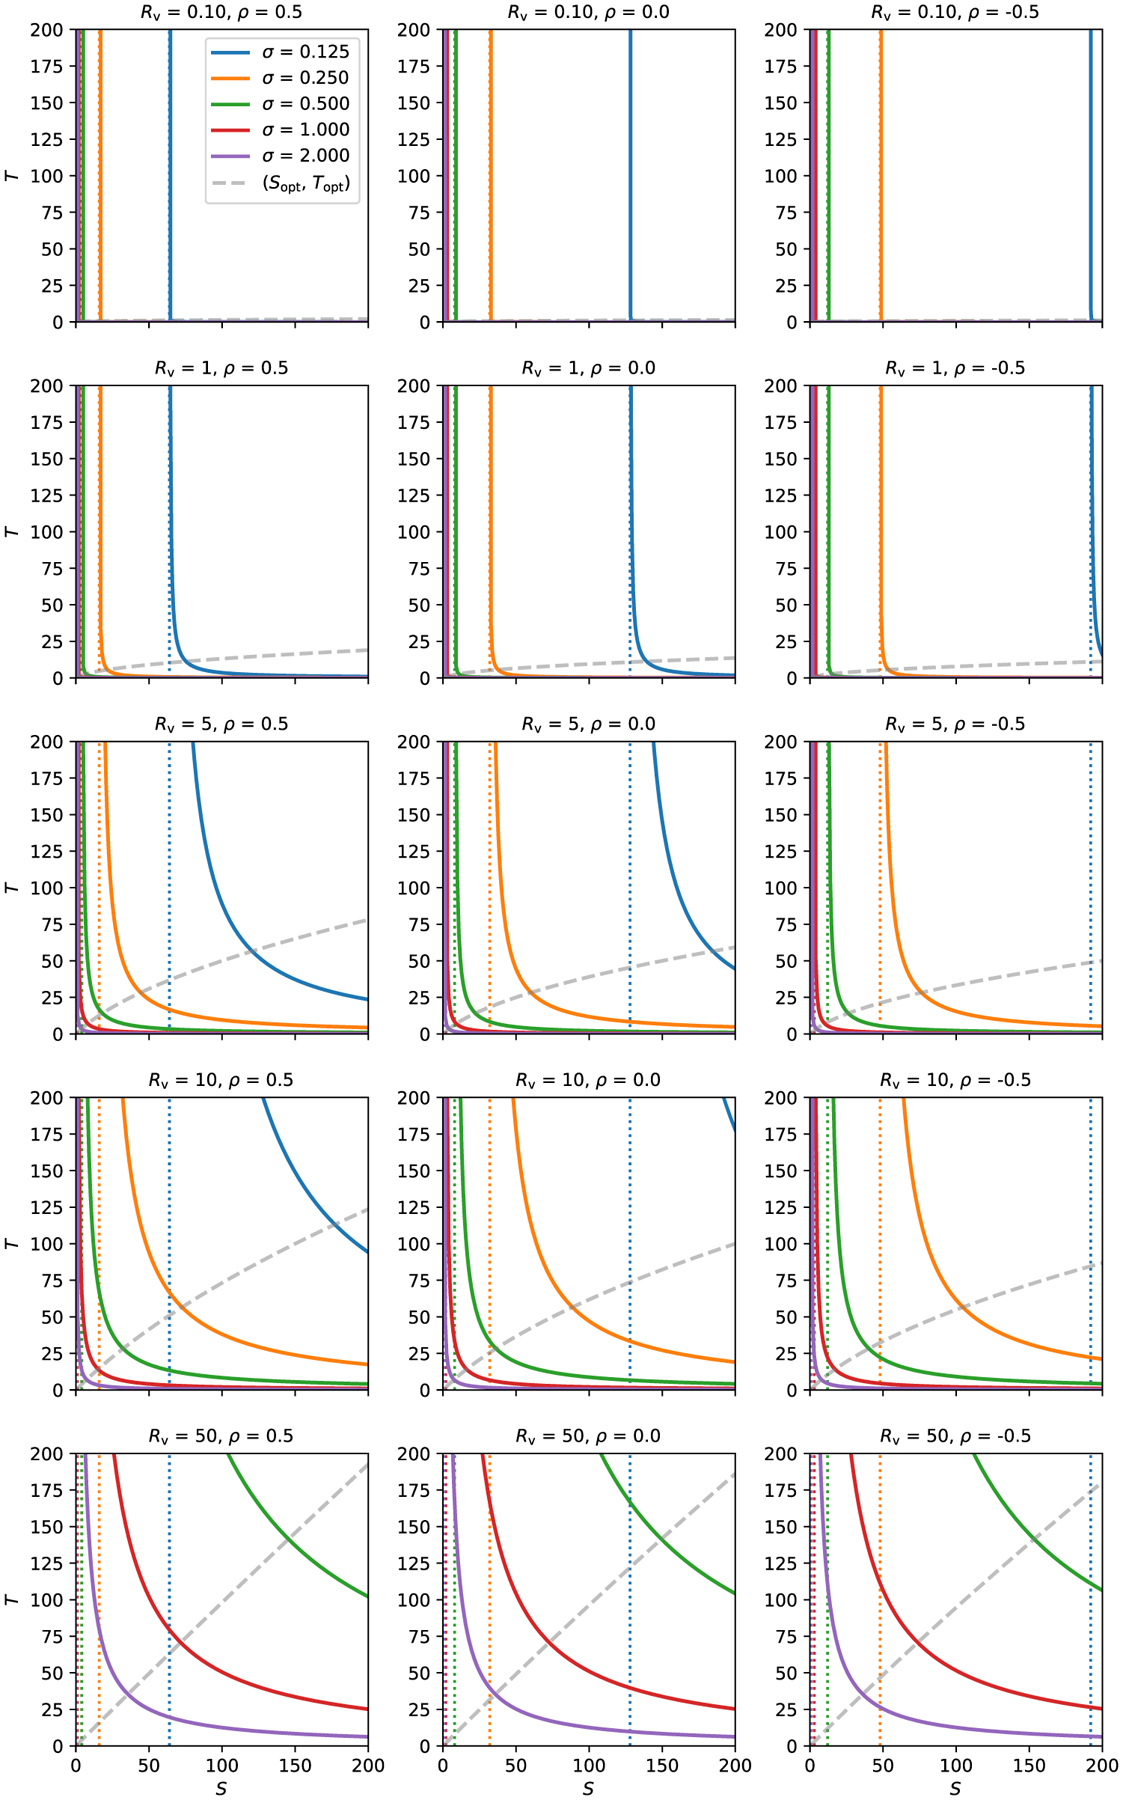
Fig. 2.

Uncertainty isocontours of subject and trial sizes. Each solid curve shows all pairs of subjects and trials that lead to the same uncertainty σ. The study properties are defined by the other parameters: each column shows a different value of ρ (0.5, 0 and −0.5), and each row has a different value of Rv (0.1, 1, 5, 10, 50). In each case, σπ = 1, so σ has the same numerical value as Rv. For a given uncertainty σ, there is a vertical asymptote occurring at S* (dotted line, with color matching the related solid curve), which is the minimum number of subjects necessary to achieve the desired uncertainty. In the first column, the five vertical asymptotes occur (corresponding to the five σ values) at S* = 64, 16, 4, 1, 0.25; in the second and third columns, each vertical asymptote occurs at twice and thrice the value in the first column, respectively. The gray (dashed) line shows a trajectory of (S, T) pairs that optimize the uncertainty σ for a given total number of samples (Appendix B). This (Sopt, Topt) curve is nearly flat for small Rv, but approaches T = S symmetry as the variability ratio Rv increases.
