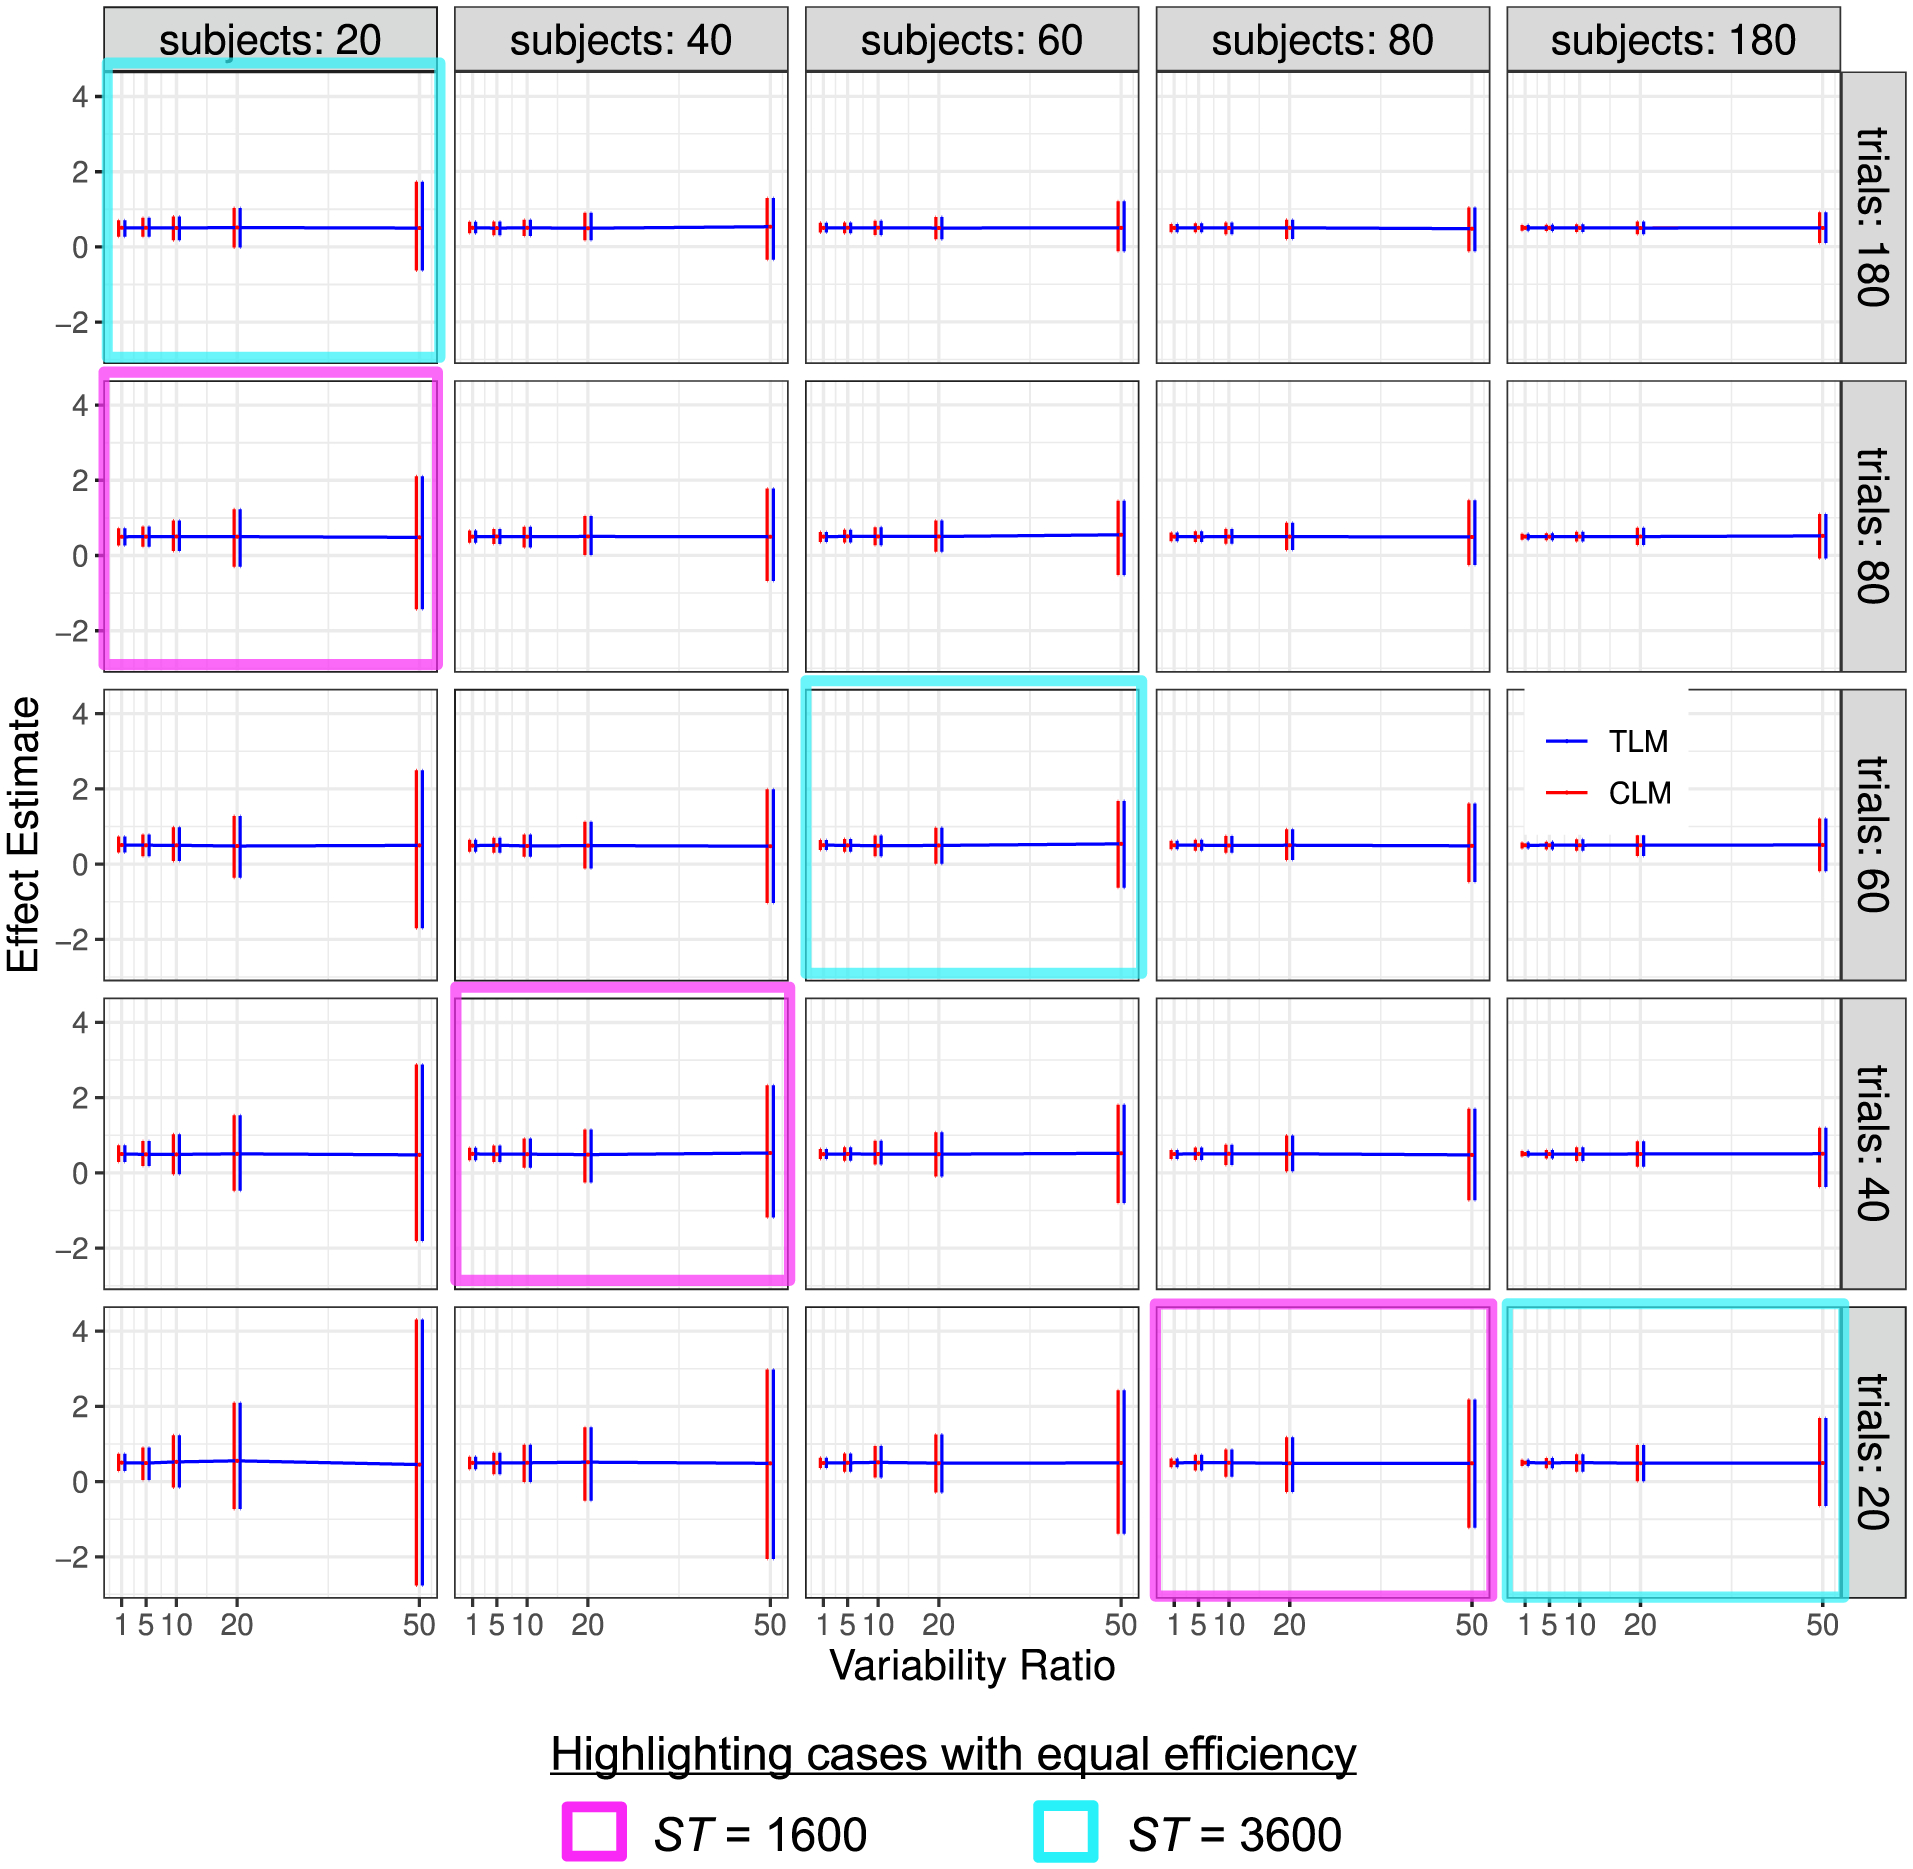
Fig. 3.

Simulation view 1: Effect estimate vs variability ratio (x and y-axes), for various numbers of trials (panel rows) and subjects (panel columns). Results from trial-level modeling (TLM) are shown in red, and those from condition-level modeling (CLM) are shown in blue. Each horizontal line tracks the mean, and each vertical bar indicates the 95% highest density interval of effect estimates from 1000 simulations. In both cases, results typically look unbiased (the mean values are very near 0.5). Estimates are quite precise for low Rv and more uncertain as the variability ratio Rv increases, as indicated by their 95% quantile intervals. The approximate symmetry of uncertainty interval between the two sample sizes, when the variability ratio is large (e.g., Rv ≥ 10) is apparent: the magenta and cyan cells each highlight sets of simulations that have roughly equal uncertainty: note how the simulation results within each magenta block look nearly identical to each other, even though the values of S and T differ (and similarly within the cyan blocks). The correlation between the two conditions is ρ = 0.5; the S, T and Rv values are not uniformly spaced, to allow for a wider variety of behavior to be displayed.
