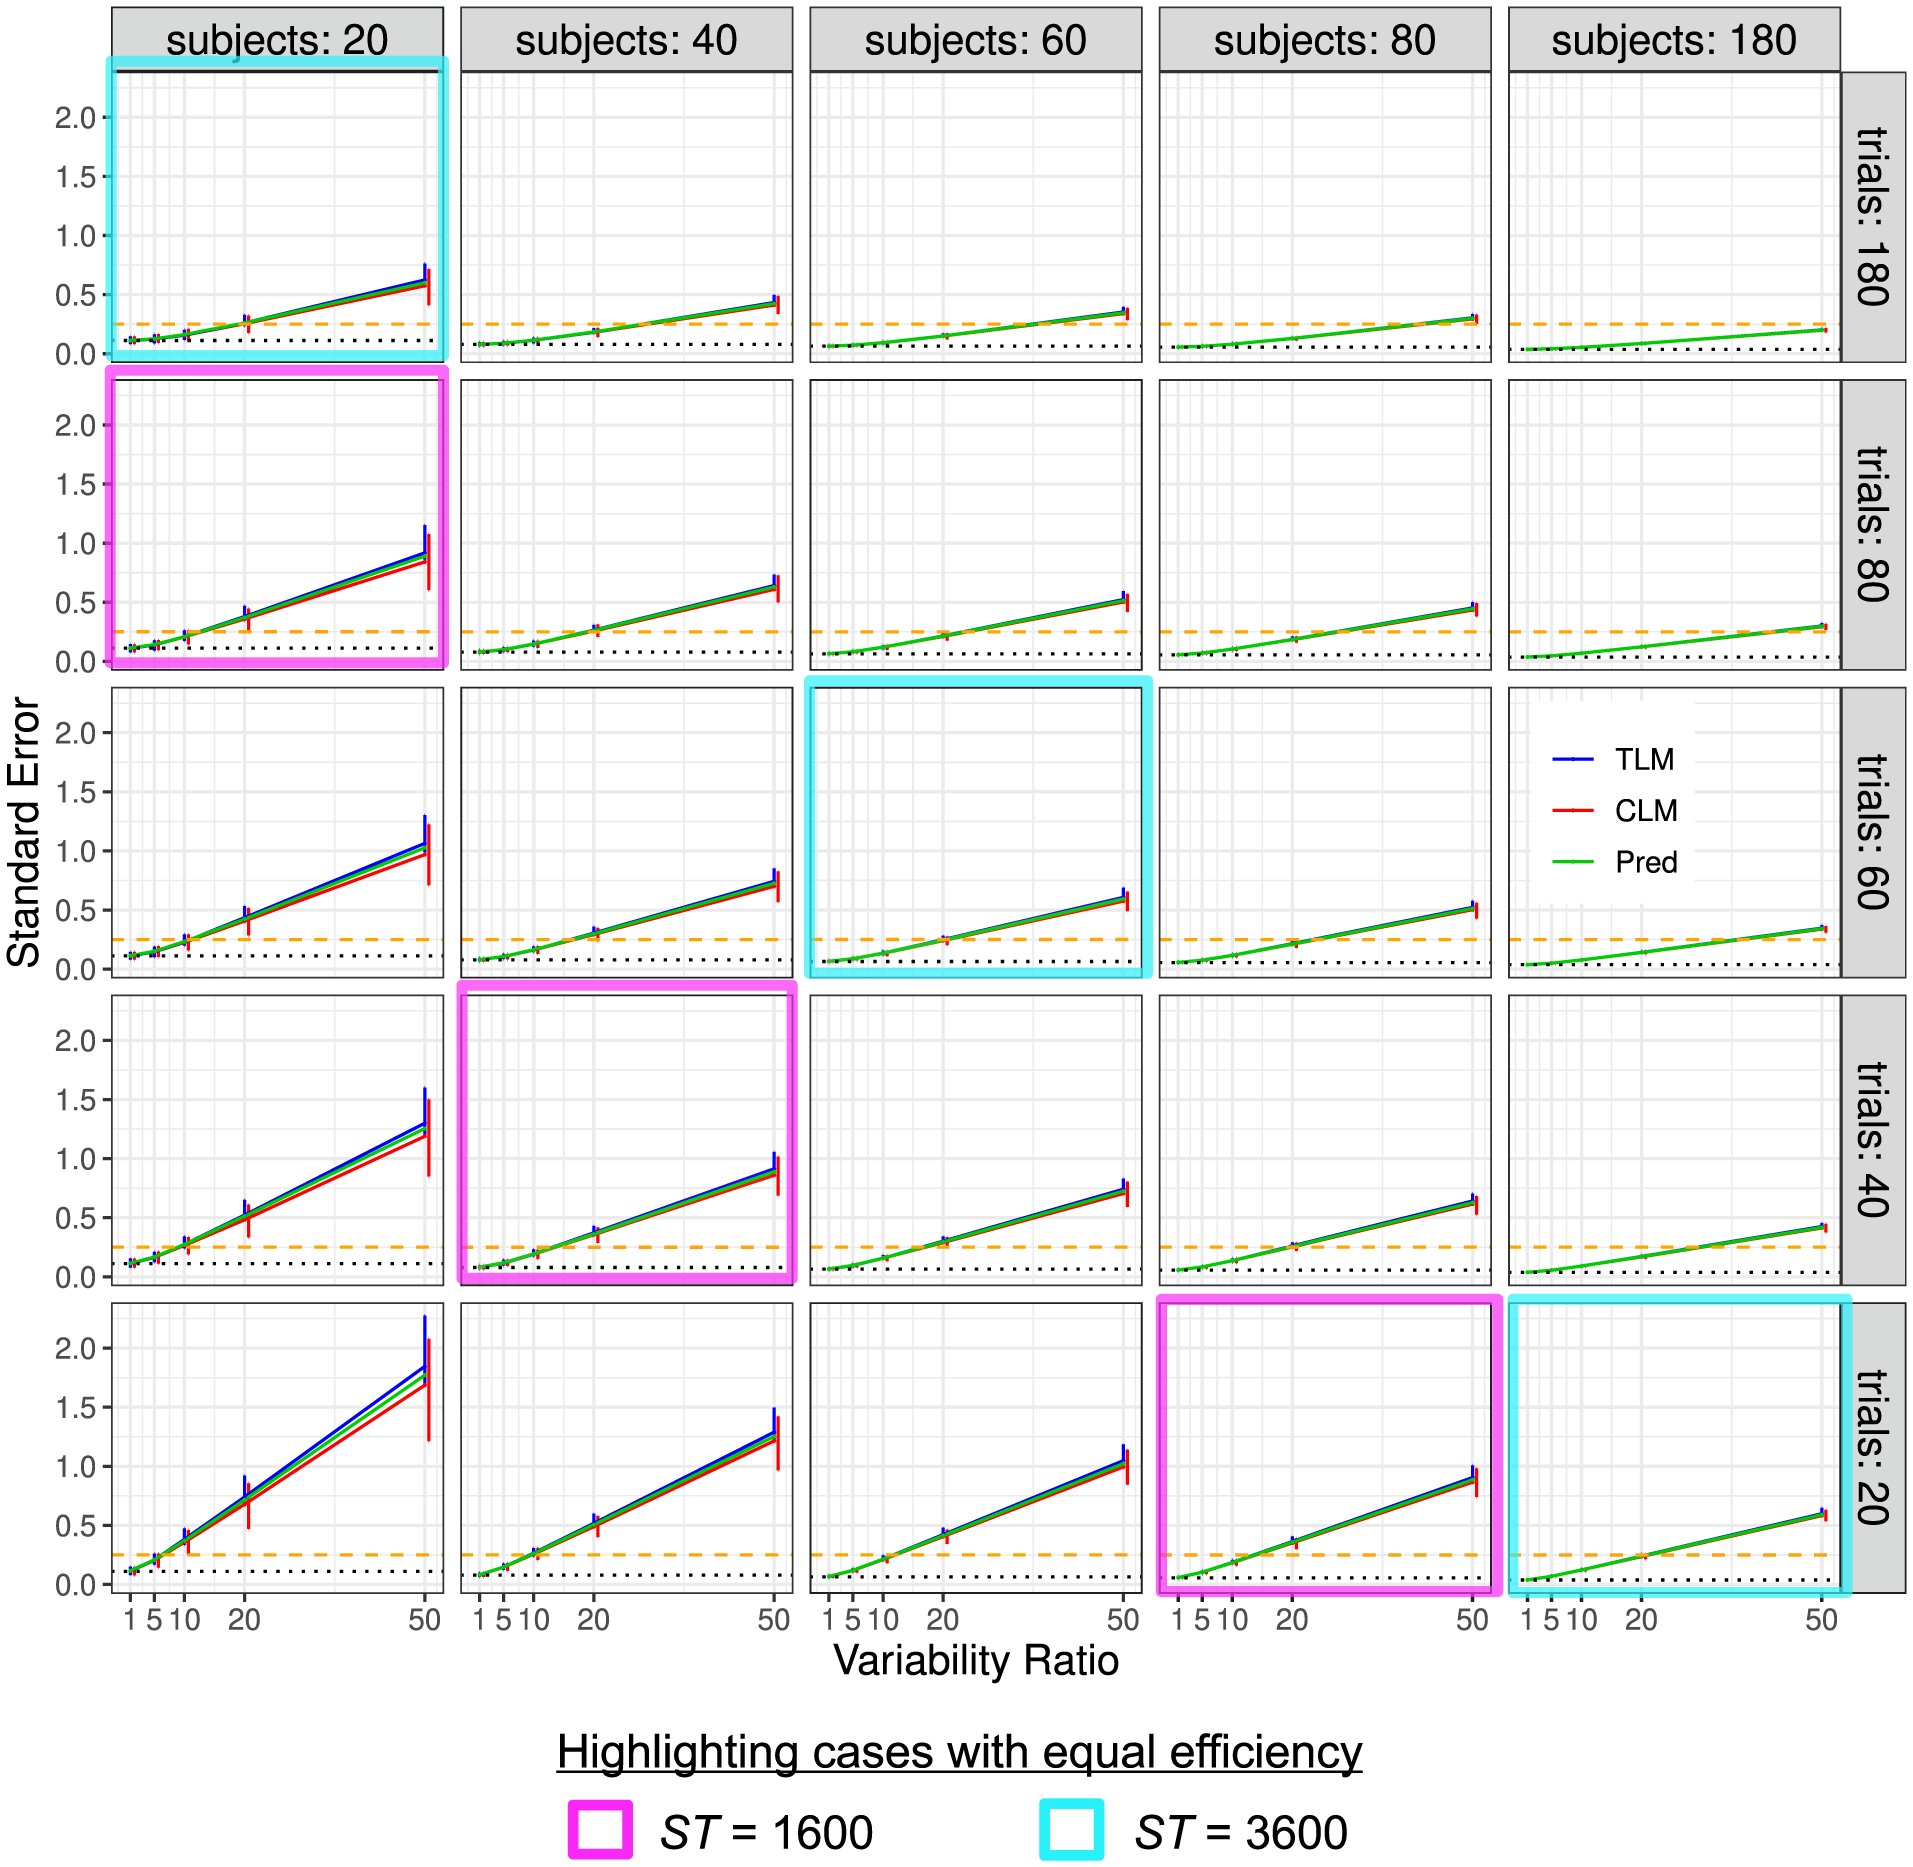
Fig. 5.

Simulation view 3: Standard error vs variability ratio (x- and y-axes), for various numbers of trials (panel rows) and subjects (panel columns). Each solid line tracks the median of the estimated standard error σ, and its 95% highest density interval (vertical bar) from 1000 simulations is displayed for each Rv, T and S. Results from trial-level modeling (TLM) are shown in red, and those from condition-level modeling (CLM) are shown in blue; the predicted (theoretical) standard error based on the formula (6) is shown in green. The dotted line (black) marks the asymptotic standard error when the variability ratio Rv is negligible (i.e., σ in Case 1) or when the number of trials is infinite. The dashed line (gold) indicates the standard error of 0.25 below which the 95% quantile interval would exclude 0 with the effect magnitude of μ = 0.5. As in Fig. 3, one can observe the approximate symmetry between the two sample sizes when the variability ratio is large (e.g., Rv ≥ 10): the magenta and cyan cells each highlight sets of simulations that have roughly equal efficiency (cf. Fig. 3). The correlation between the two conditions is = 0.5.
