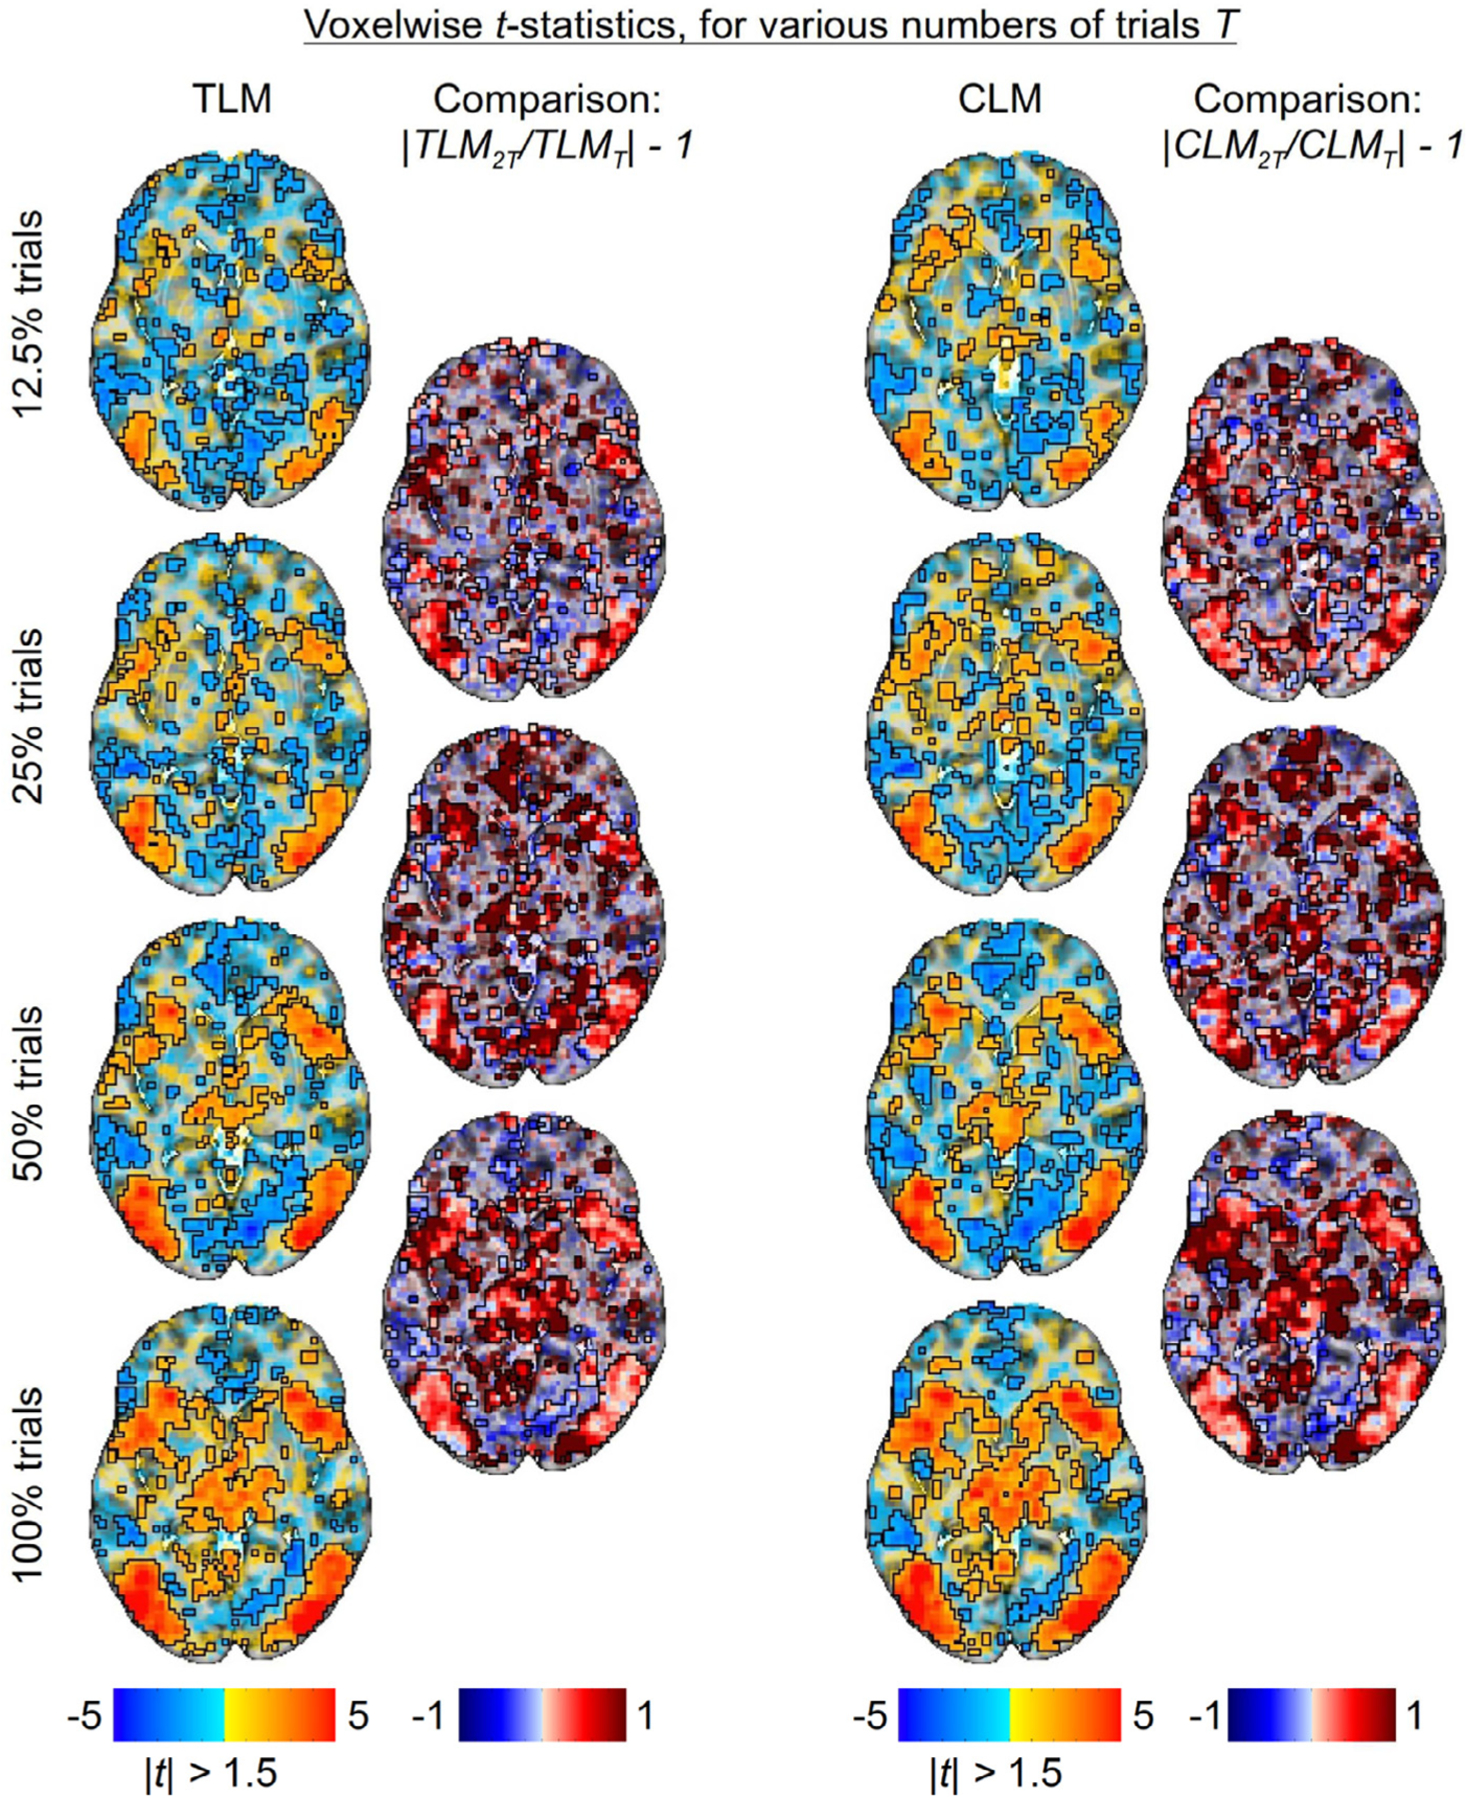
Fig. 9.

Statistical evidence with varying number of trials (Z = 0 axial slice). For both TLM and CLM approaches, the relative change in statistical value for the contrast between incongruent and congruent conditions, as the trial sample size doubles, is displayed as a map of the ratio of t-statistic magnitudes, centered on one. Thus, red shows an increase in statistical value with trial sample size and blue shows a decrease. The patterns for TLM and CLM are quite similar, increasing in most suprathreshold regions. In regions with relatively small cross-trial variability, it is expected that statistical efficiency should improve with the square of the trial sample size, since the number of trials doubles between two neighboring rows, one would expect about fractional increase, which is generally consistent with the results here.
