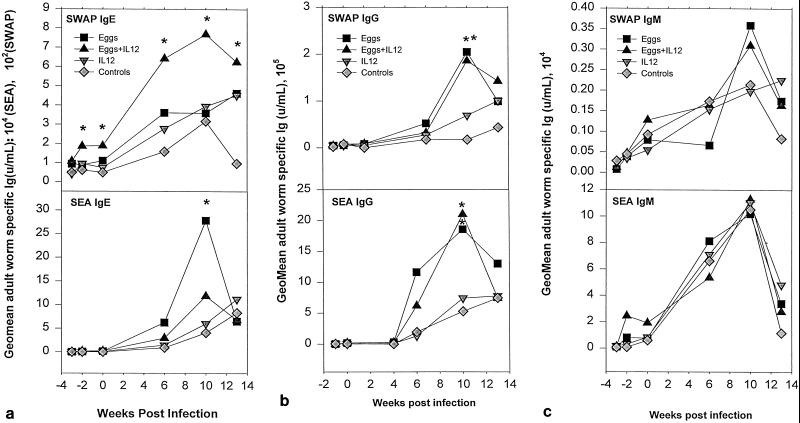
FIG. 5.
Levels of parasite-specific IgE (a), IgG (b), and IgM (c) in serum after immunization and during the course of acute S. mansoni infection of baboons. Each point represents the geometric mean antibody titer for six baboons (except for the three baboons in the saline control group). Asterisks (∗, P < 0.05; ∗∗, P < 0.01) indicate serum antibody titers that are significantly different between groups of animals at a particular time after primary infection.

