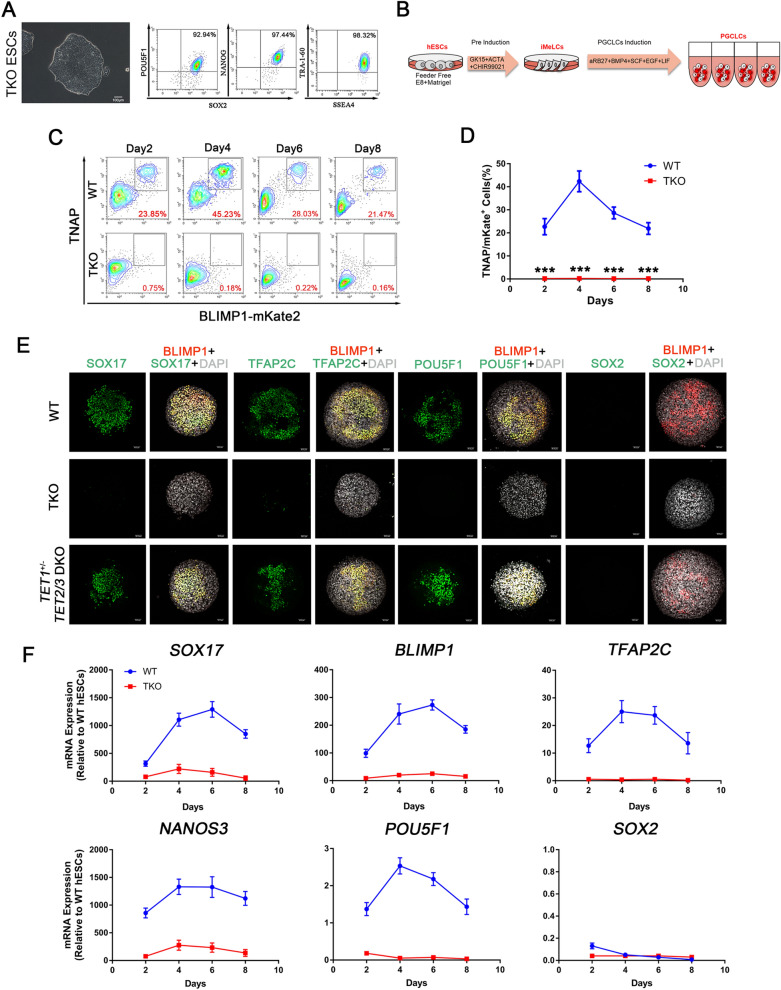
Fig. 1.
TET TKO hESCs Exhibit hPGC Differentiation Defects. A Left, A phase-contrast image of TKO hESCs. Scale bar = 100 μm. Right, FACS analysis for POU5F1, SOX2, NANOG, TRA-1-60 and SSEA-4 expression in TKO hESCs; B Scheme of hPGC differentiation through iMeLCs in vitro; C FACS analysis of WT and TKO hESCs on hPGCLCs induction for 8 days. Boxed areas indicate TNAP/BLIMP1 (+) cells with their percentages. D Quantification of TNAP/BLIMP1 (+) cells at day 2, 4, 6 and 8 of hPGC induction; n = 3 independent experiments. Data are presented as means ± s.d. Statistical analysis was performed by Student’s t-test (two-sided), ***represent compared to WT group p < 0.001; E Immunofluorescence of SOX17, TFAP2C, POU5F1, BLIMP1 and SOX2 at the day4 embryoids for WT and TKO cells. Scale bar = 50 μm; F RT-qPCR analysis for SOX17, BLIMP1, TFAP2C, NANOS3, POU5F1 and SOX2 during hPGC differentiation in day 2 ~ 8 embryoids; n = 3 independent experiments. Data are presented as means ± s.d

