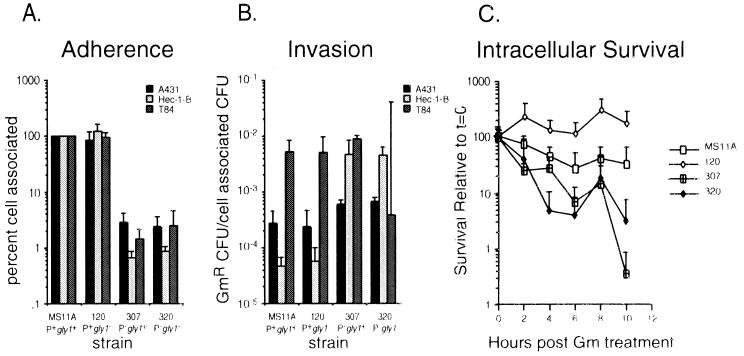
FIG. 4.
Interaction of N. gonorrhoeae gly1 mutants with epithelial cells in tissue culture. MS11A: P+gly1+; 120: P+gly1; 307: P−gly1+; 320: P−gly1. (A) Adherence to A431, HEC-1-B, and T84 cells. Adhesion data are presented as a percentage of the wild-type control (MS11A). (B) Invasion of A431, Hec-1-B, and T84 cells. Invasion data are presented as the ratio of GM-resistant (Gmr) bacteria per number of cell associated bacteria. (C) Survival within A431 cells. Survival is expressed as the number of GM-resistant (Gmr) CFU at each time point relative to the number of Gmr CFU immediately following GM treatment. Error bars indicate average deviations.

