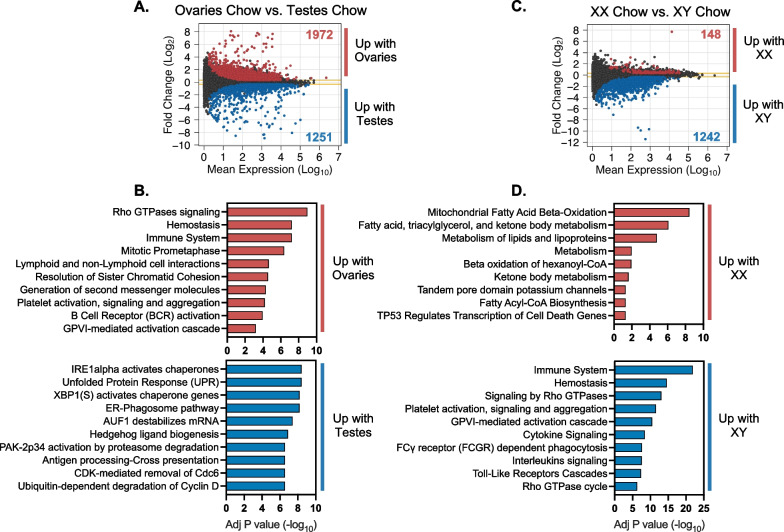
Fig. 3.
Gonadal and chromosomal sex impact gene expression in Apoe–/– FCG liver. MA plot shows mean expression and fold-change of genes with differential expression in A mice with ovaries compared to mice with testes (adjusted P < 0.05, fold-change > 1.25) and B the top 10 significant cellular pathways enriched in the differentially expressed genes (adjusted P < 0.05). MA plot shows mean expression and fold-change of genes with differential expression in C XX mice compared to XY mice (adjusted P < 0.05, fold-change > 1.25) and D the top 10 significant cellular pathways enriched in the differentially expressed genes (adjusted P < 0.05)

