Fig. 6.
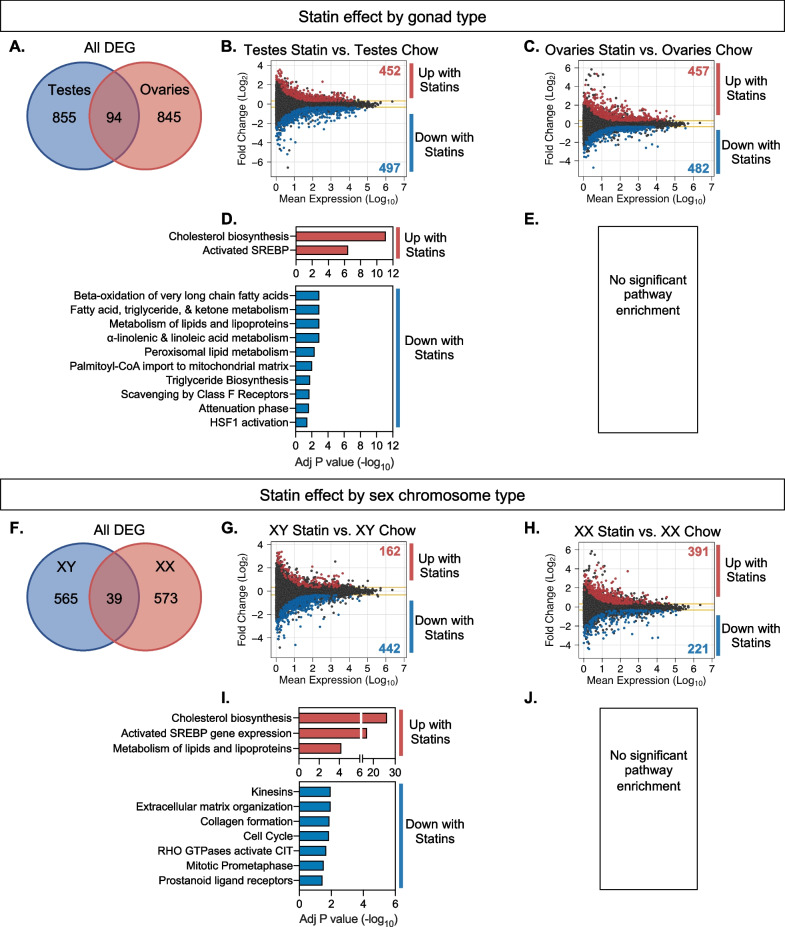
Statin effects on hepatic gene expression are influenced in distinct ways by gonadal and chromosomal sex. A Venn diagram shows number of genes altered by statin treatment depending on presence of ovaries or testes, and the minimal overlap between the two. MA plots display mean expression levels and fold-change of differentially expressed genes (DESeq2, > 1.25-fold altered expression, P < 0.05) in B statin-treated mice with testes compared to chow diet controls and C statin-treated mice with ovaries compared to chow diet controls. Significantly enriched cellular pathways for statin-induced gene expression changes in D mice with testes and E mice with ovaries (no enriched pathways). F Venn diagram shows number of genes altered by statin treatment depending on presence of XX or XY chromosomes, and the minimal overlap between the two. MA plots display mean expression levels and fold-change of differentially expressed genes (DESeq2) in G statin-treated XY mice compared to chow diet controls and H statin-treated XX mice compared to chow diet controls. Significantly enriched cellular pathways for statin-induced gene expression changes in I XY mice and J XX mice (no enriched pathways)

