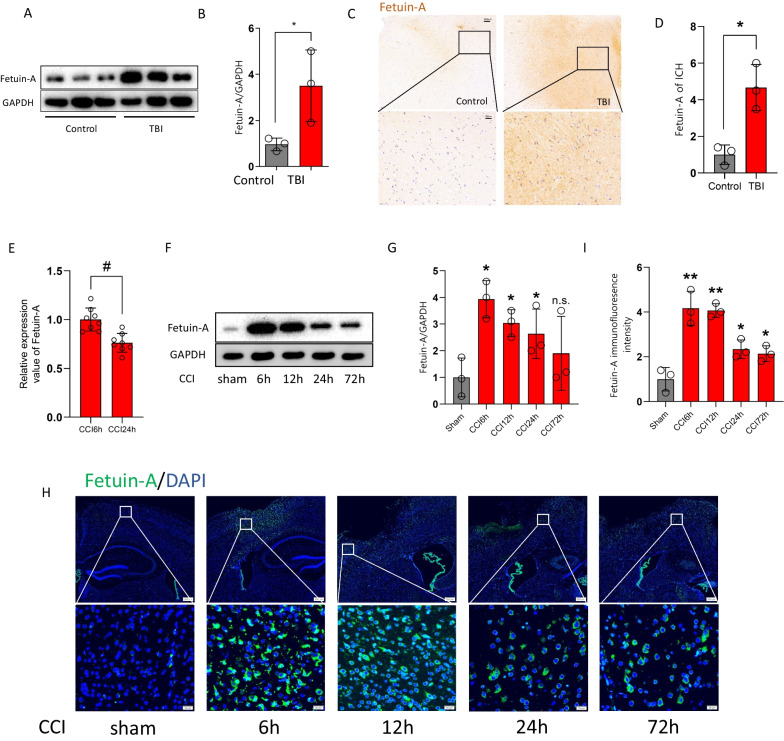
Fig. 2.
Fetuin-A is overexpressed after brain injury. A, B Western blot analysis and densitometric quantification of Fetuin-A expression by ImageJ in brain tissue of control (n = 3 samples) and TBI (n = 3 samples) patients. C, D Immunohistochemistry assessment of Fetuin-A expression in brain tissue from control and TBI patients. Scale bar is 20 or 100 μm. The relative intensity of Fetuin-A was detected with Image-J software. E The relative protein level of Fetuin-A in CCI6h vs. CCI24h (n = 8 samples) from quantitative proteomics analysis. F, G Protein levels of Fetuin-A obtained from sham mice and CCI mouse brain tissue. GAPDH is used as the loading control. And bar graphs show the results of analysis (by band density analysis) of Fetuin-A (sham = 3, CCI = 3). H, I Immunofluorescence assessment of Fetuin-A (green). Scale bar is 20 or 200 μm. The relative immunofluorescence intensity of Fetuin-A was detected with Image-J software. Data presented as mean ± SD (n = 5). *P < 0.05 vs. control group or sham group, **P < 0.01 vs. control group or sham group, and #P < 0.05 vs. CCI6h group

