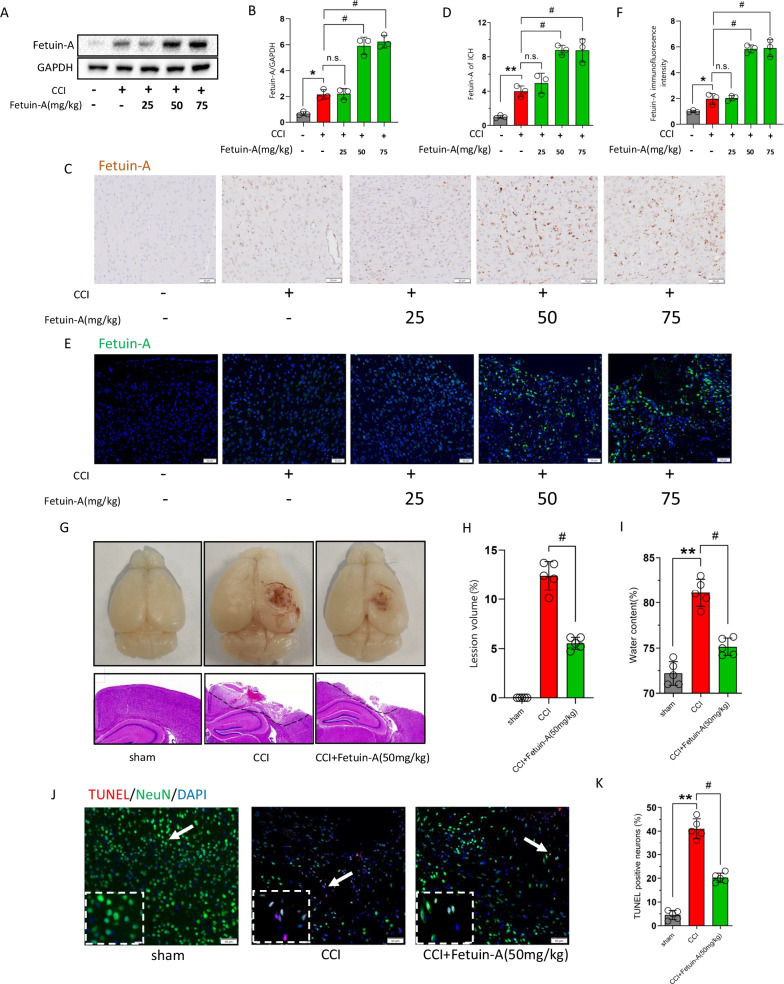
Fig. 3.
Peripheral administration of Fetuin-A exerted protective effects after CCI. The mice were treated with Fetuin-A at indicated concentrations after CCI. A, B Protein levels of Fetuin-A obtained from sham mice and CCI mice at 6 h. GAPDH was used as the loading control. And bar graphs show the results of analysis (by band density analysis) of Fetuin-A (sham = 3, CCI = 3). C, D Immunohistochemistry assessment of Fetuin-A in sham and CCI at 6 h (scale bar = 50 μm, n = 3). The relative intensity of Fetuin-A was detected with Image-J software. E, F Immunofluorescence assessment of Fetuin-A. Scale bar is 50 μm. The relative immunofluorescence intensity of Fetuin-A was detected with Image-J software (n = 3). G Representative photographs of whole brains and H&E staining of hemicerebrum sections (n = 3). H, I Lesion volume (n = 5) and water content% (n = 5) were analyzed by statistical. J, K Neuron death measured by TUNEL staining. Scale bar is 50 μm (n = 5). Data are presented as the means ± SD; *P < 0.05 vs. sham group, **P < 0.01 vs. sham group, and #P < 0.05 vs. CCI group

