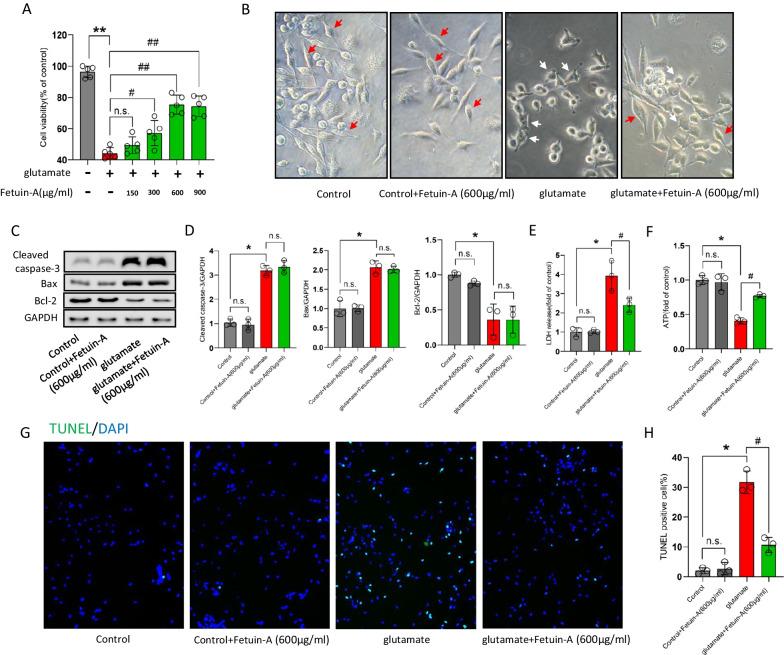
Fig. 5.
Fetuin-A failure to inhibit apoptosis in vitro. The microglial cells were treated with 100 μm glutamate (Glu) for 24 h to induce cellular injury. Meanwhile, Fetuin-A was treated into medium at indicated concentrations. A Cell viability was measured by Cell Counting Kit-8 assay (n = 5). B Representative photomicrographs of microglial cells in different groups (red arrows represent microglia in normal state and white arrows represent microglia in the activated state). Scale bar is 20 μm. C, D Expression of cleaved caspase-3, Bax, and Bcl-2 in microglial cells under various treatment conditions. GAPDH was used as the loading control. And bar graphs show the results of analysis (by band density analysis) of these proteins (n = 3). E LDH release assay (n = 3). F ATP production was measured by CellTiter-Glo ATP-based luminescence assays (n = 3). G, H Microglial death measured by TUNEL staining. Scale bar is 50 μm (n = 7). Data are presented as the means ± SD; *P < 0.05 vs. control, **P < 0.01 vs. control, #P < 0.05 vs. Glu group, ##P < 0.01 vs. Glu group and n.s.: no significant difference

