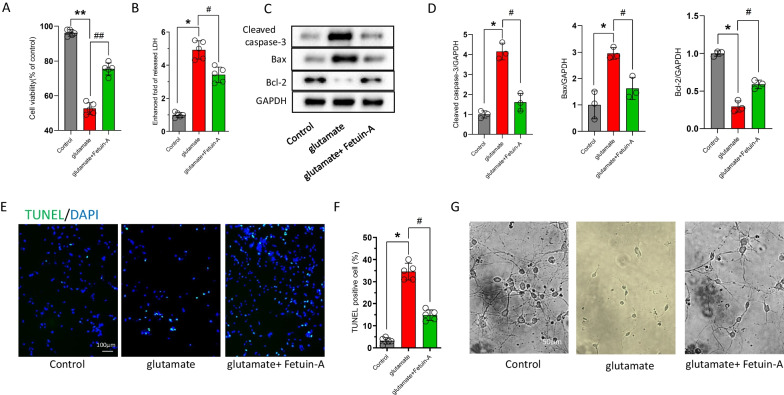
Fig. 9.
Fetuin-A suppressed neuronal damage in vitro. The primary cortical neurons were cultured in neurobasal medium with 2% B27 and 0.5 mM glutamate. Then, the neurons were treated with the microglia-conditioned medium. A Cell viability was measured by Cell Counting Kit-8 assay (n = 5). B LDH release assay (n = 5). C, D Western blot analysis of the apoptosis-related proteins expression. GAPDH was used as the loading control. And bar graphs show the results of analysis (by band density analysis) of these proteins (n = 3). E, F Cell death measured by TUNEL staining of primary neurons. Scale bar is 100 μm (n = 5). G Representative images of neurons growth 1 week after different treatments. Scale bar is 50 μm (n = 5). Data are presented as the means ± SD; *P < 0.05 vs. control, **P < 0.01 vs. control, #P < 0.05 vs. Glu group

