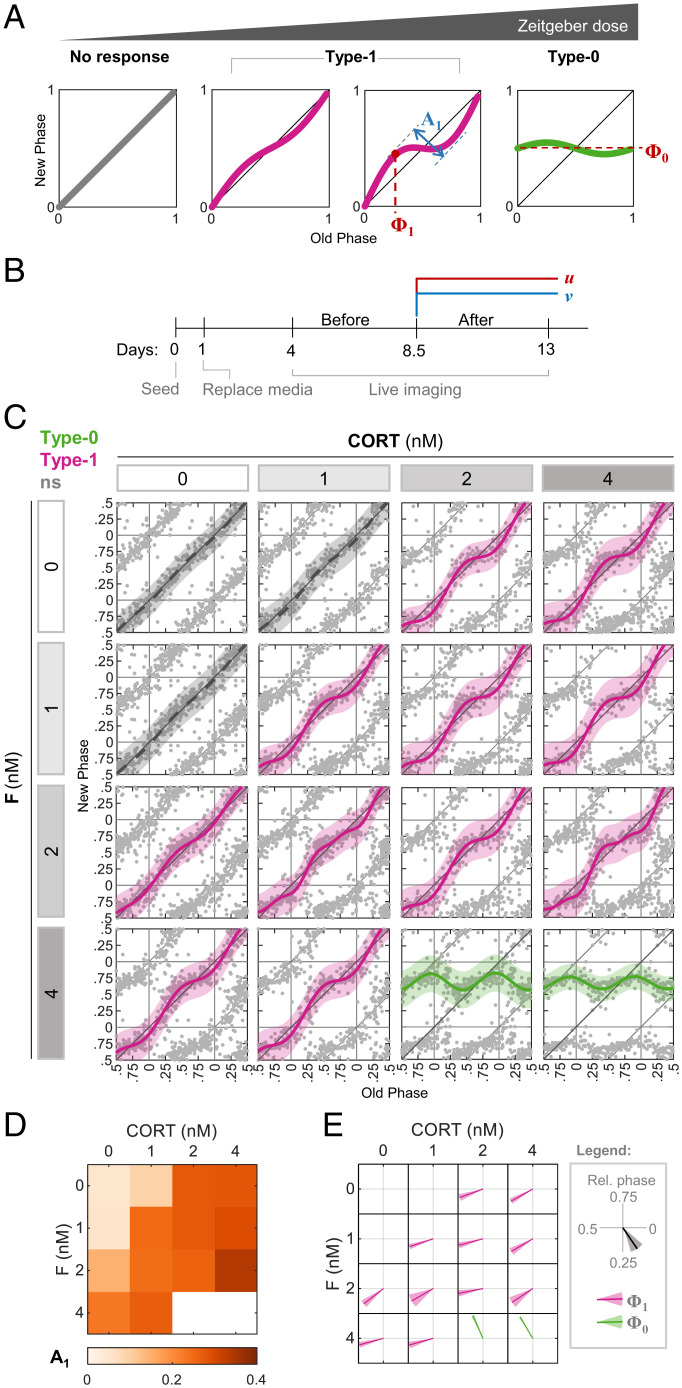
Fig. 1.
Effects of the simultaneous administration of combinations of stimuli on PTC characteristics. (A) Schematic depiction of the progressive change in PTC in response to increasing dose of the zeitgeber, from no response through type 1 topology to type 0. We define the following parameters for analysis: type 1 PTC amplitude (A1) is the difference between the maximal phase advance and the maximal phase delay; type 1 PTC phase (Φ1) is the old phase, in which the maximal phase delay is induced; and type 0 mean new phase (Φ0) is the average new phase induced across all of the old phases. Across the study, phases are given in relative units (normalized to the period length). (B) Schematic depiction of the experimental design. At 1 d postseeding, media was replaced, and live imaging started after 3 additional days. Two treatments (u and v) were added simultaneously to the culture in different combinations 8.5 d postseeding. (C) PTC matrix of the response to CORT and F given in different concentrations, as reconstructed by Circa-SCOPE. Each point represents the phases of a single cell. Data are double plotted for clarity. Pink: type 1 resetting model ± 95% confidence interval, green: type 0 resetting model ± 95% confidence interval, ns: nonsignificant (P > 0.05) in bootstrapping test for response, n = 138 to 267 cells per concentration (SI Appendix, Dataset S1). (D) Type 1 PTC amplitude in each combination of CORT and F from (C). (E) Vector plot of the type 1 PTC phase (pink) and type 0 mean new phase (green) in each combination of CORT and F from (C). Vector direction represents the relative phase ± SD from bootstrapping.

