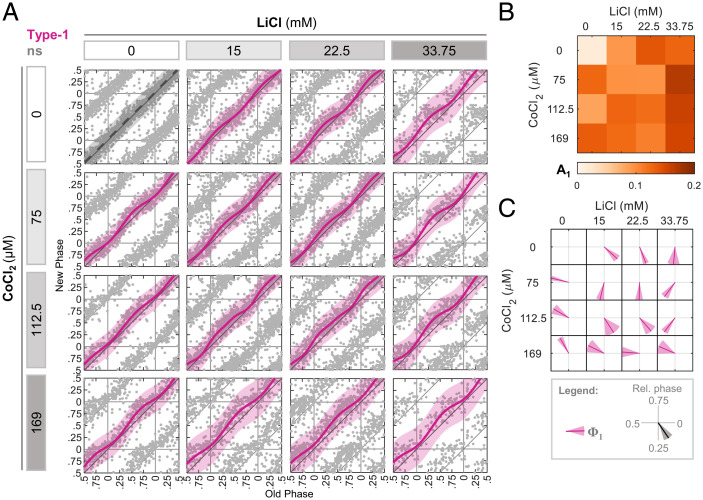
Fig. 2.
Complex phase response upon combination of LiCl and CoCl2. (A) PTC matrix of the response to LiCl and CoCl2 given in different concentrations. Each point represents the phases of a single cell. Data are double plotted for clarity. Pink: type 1 resetting model ± 95% confidence interval, ns: P > 0.05 in bootstrapping test for response, n = 97 to 479 cells per concentration (SI Appendix, Dataset S2). (B) Type 1 PTC amplitude in each combination of LiCl and CoCl2 from (A). (C) Vector plot of the type 1 PTC phase (pink) in each combination of LiCl and CoCl2 from (A). Vector direction represents the relative phase ± SD from bootstrapping-based distribution.

