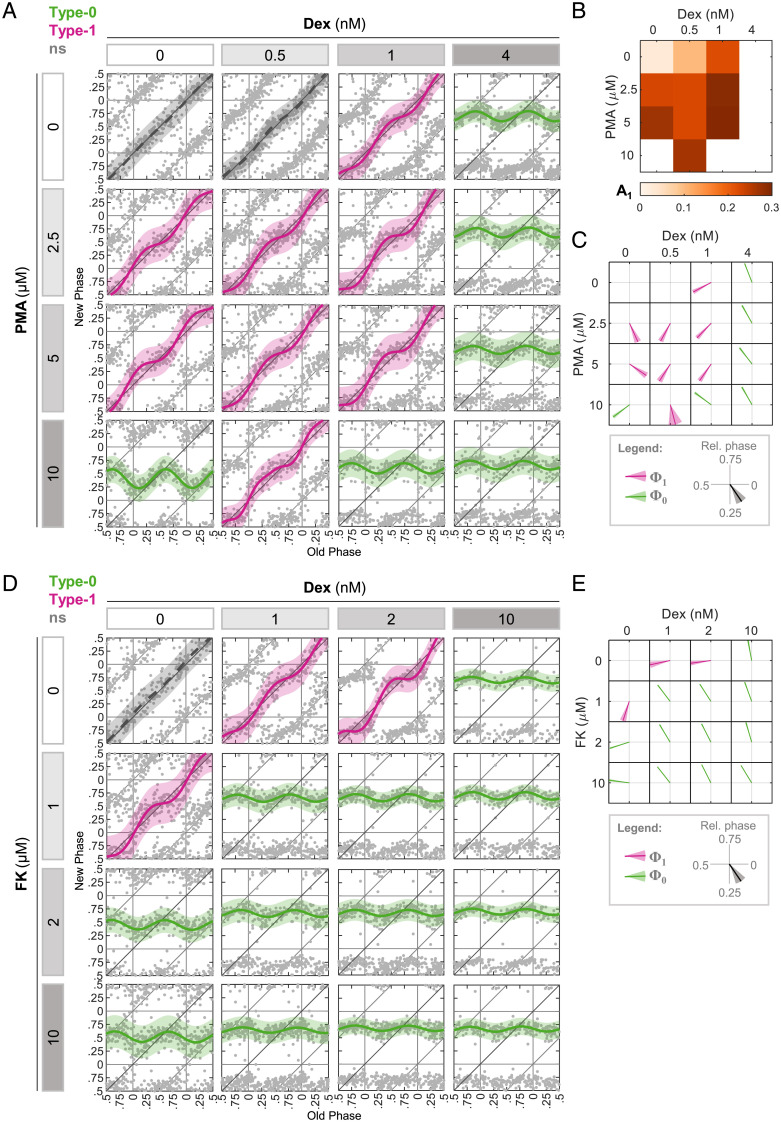
Fig. 3.
Dominance in phase response upon different zeitgeber combinations. (A) PTC matrix of the response to Dex and PMA given in different concentrations. Each point represents the phases of a single cell. Data are double plotted for clarity. Pink: type 1 resetting model ± 95% confidence interval, green: type 0 resetting model ± 95% confidence interval, ns: P > 0.05 in bootstrapping test for response, n = 151 to 328 cells per concentration (SI Appendix, Dataset S3). (B) Type 1 PTC amplitude in each combination of Dex and PMA from (A). (C) Vector plot of the type 1 PTC phase (pink) and type 0 mean new phase (green) in each combination of Dex and PMA from (A). Vector direction represents the relative phase ± SD from bootstrapping-based distribution. (D) PTC matrix of the response to Dex and FK given in different concentrations. Each point represents the phases of a single cell. Data are double plotted for clarity. Pink: type 1 resetting model ± 95% confidence interval, green: type 0 resetting model ± 95% confidence interval, ns: P > 0.05 in bootstrapping test for response, n = 91 to 208 cells per concentration (SI Appendix, Dataset S4). (E) Vector plot of the type 1 PTC phase (pink) and type 0 mean new phase (green) in each combination of Dex and FK from (D). Vector direction represents the relative phase ± SD from bootstrapping-based distribution.

