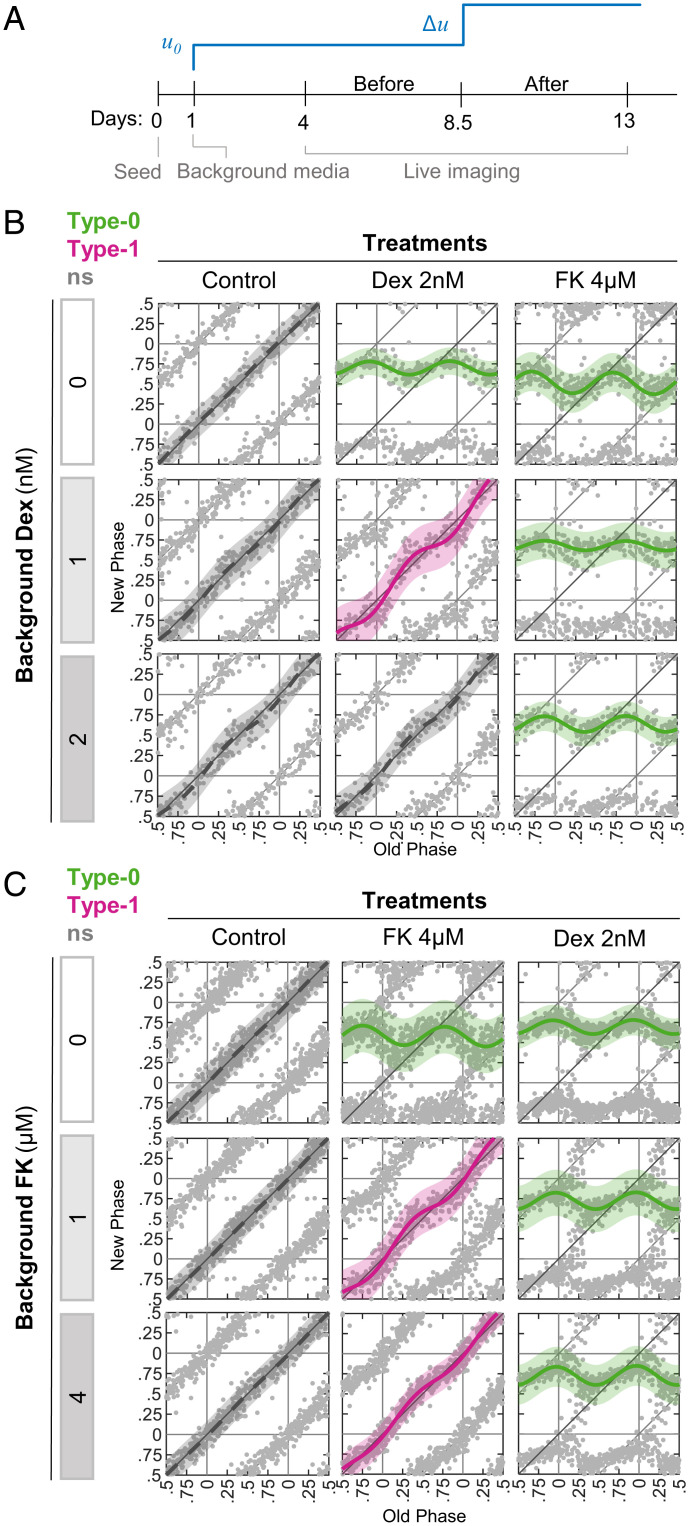
Fig. 4.
Pathway-specific effect of signal background levels on phase response. (A) Schematic depiction of the experimental design. At 1 d postseeding, media was replaced and supplemented with background levels of the signal of choice (u0) (“background media”). As a treatment, an additional dose of the signal (Δu) was given 8.5 d postseeding. (B) Increasing doses of Dex were added in background media, and then cells were treated with either Dex or FK. Depicted are the PTCs reconstructed from each background-treatment combination. Pink: type 1 resetting model ± 95% confidence interval, green: type 0 resetting model ± 95% confidence interval, ns: P > 0.05 in bootstrapping test for response, n = 116 to 201 cells per concentration (SI Appendix, Dataset S5). (C) Increasing doses of FK added in background media, and then cells were treated with either Dex or FK. Depicted are the PTCs reconstructed from each background-treatment combination. Pink: type 1 resetting model ± 95% confidence interval, green: type 0 resetting model ± 95% confidence interval, ns: P > 0.05 in bootstrapping test for response, n = 259 to 438 cells per concentration (SI Appendix, Dataset S6).

