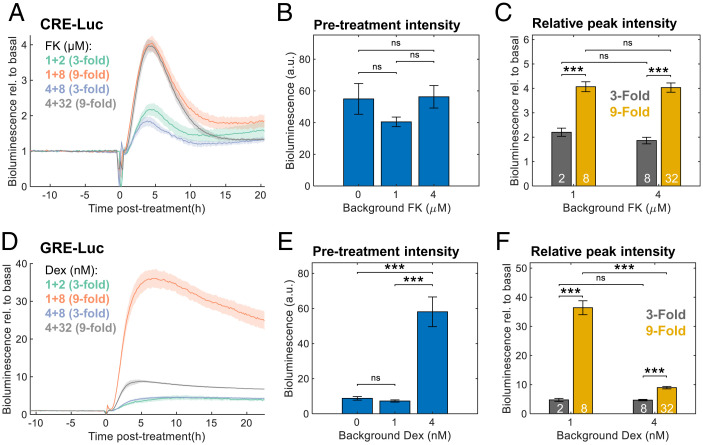
Fig. 6.
Fold-change detection in FK- but not Dex-induced gene expression. (A) Cells were transfected with CRE-Luc reporter and treated with different background concentrations of FK. After 2 d of bioluminescence recording, different doses of FK were added. The bioluminescence data are presented relative to the pretreatment levels per sample; concentrations are given in micromolars (background + treatment). Means ± SEs, n = 4 plates per condition. (B) Average bioluminescence levels of CRE-Luc during 10 h of pretreatment with different background FK levels. Means ± SEs, n = 8 plates per condition; ns in two-sample Student’s t test. (C) Fold-change induction of CRE-Luc (maximal bioluminescence posttreatment divided by the pretreatment levels). White numbers: FK treatment concentrations in micromolars; means ± SEs, n = 4 plates per condition, ***P < 0.001, two-sample Student’s t test. (D) Cells were transfected with GRE-Luc reporter and treated with different background concentrations of Dex. After 2 d of bioluminescence recording, different doses of Dex were added. The bioluminescence data are presented relative to the pretreatment levels per sample; concentrations are given in nanomolars (background + treatment). Means ± SEs, n = 4 plates per condition. (E) Average bioluminescence levels of GRE-Luc during 10 h of pretreatment with different background Dex levels (means ± SEs, n = 8 plates per condition, ns in two-sample Student’s t test). (F) Fold-change induction of GRE-Luc (maximal bioluminescence posttreatment divided by the pretreatment levels). White numbers: Dex treatment concentrations in nanomolars; means ± SEs, n = 4 plates per condition, ***P < 0.001, two-sample Student’s t test.

