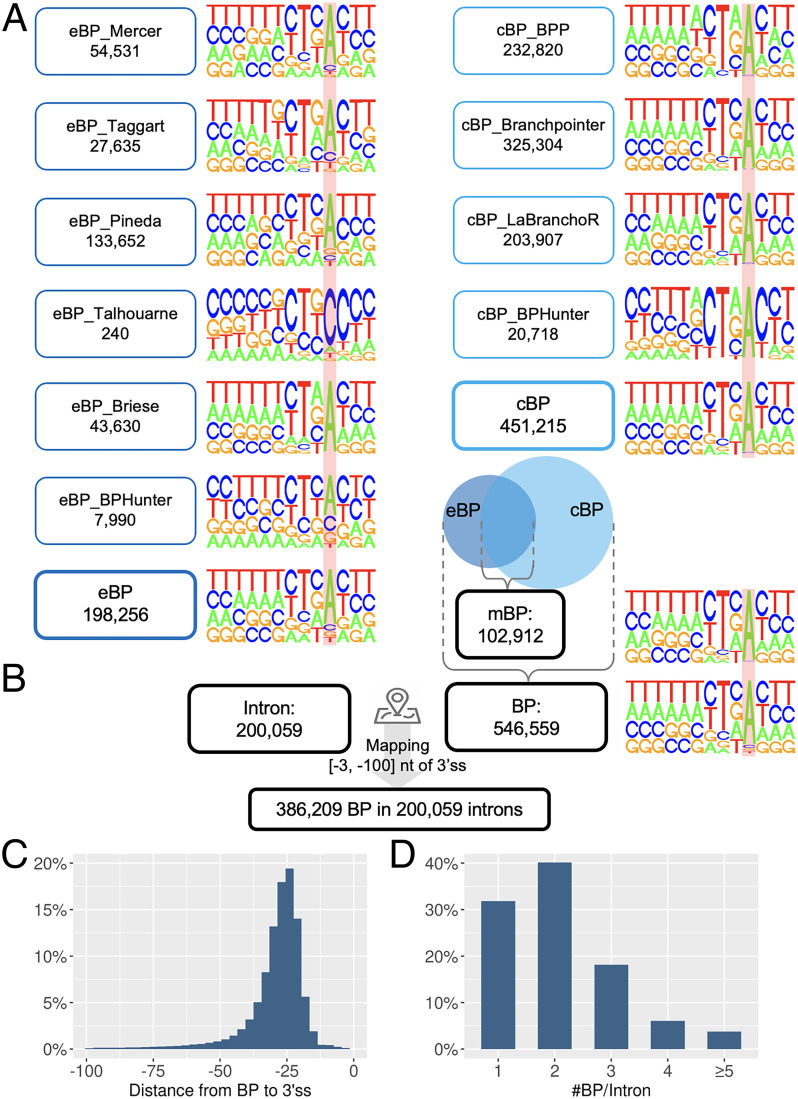
Fig. 2.
Integration of all BP datasets and mapping of BP onto introns. (A) The nucleotide composition displays the motif [−9, +3] of BP, where the locations of BP are marked with a red background. (B) BP were mapped to 3′-proximal intron. (C) Distance from the mapped BP to their corresponding 3′ss. (D) The number of BP mapped to each 3′-proximal intron.

