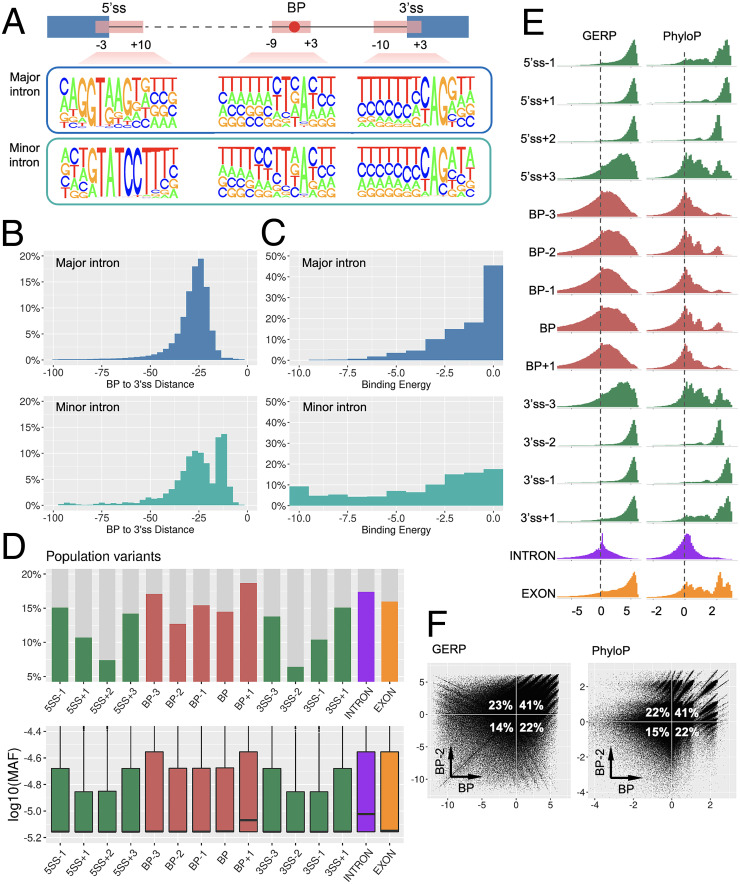
Fig. 3.
Characterization of BP. (A) Nucleotide composition of BP, 5′ss, and 3′ss motifs in major and minor introns. (B) The distance from BP to 3′ss in major and minor introns. (C) The binding energy between BP motif and U2/U12 snRNA in major and minor introns (the lower the energy, the higher the binding affinity). (D) The proportion of each genomic position harboring population variants (Upper), and the MAF distribution of population variants (Lower). (E) The distribution of the conservation scores GERP (Left) and PhyloP (Right) in each genomic position. (F) The cross-compared conservation scores between BP and BP−2 positions.

