Fig. 1.
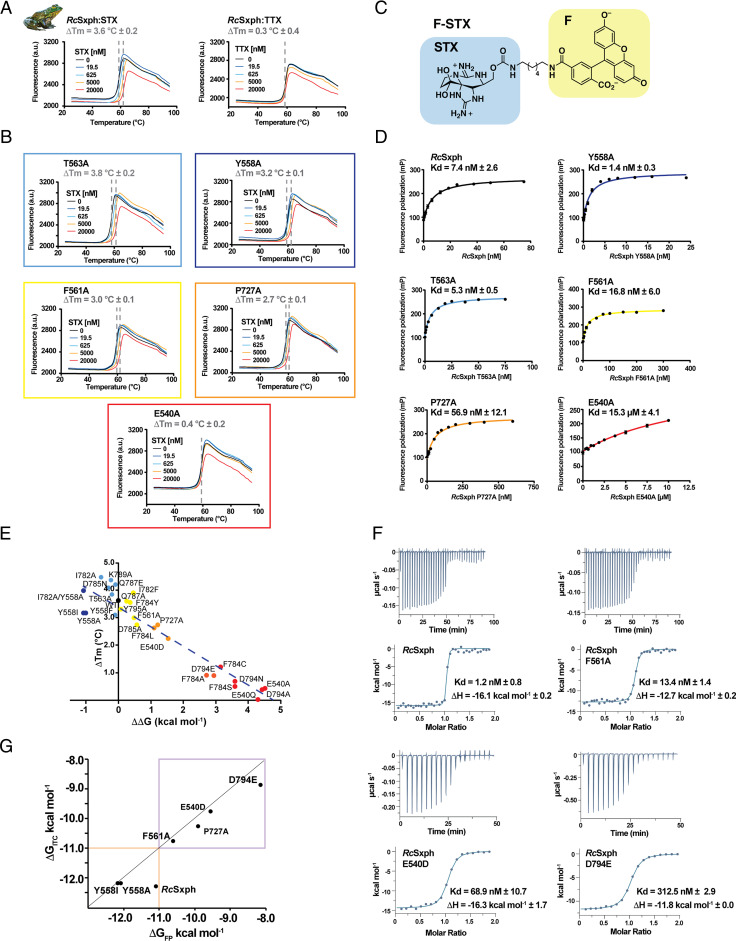
Alanine scan of RcSxph binding. (A and B) Exemplar TF assay results for (A) RcSxph in the presence of the indicated concentrations of STX (Left) and TTX (Right) and (B) select RcSxph mutants in the presence of STX. STX and TTX concentrations are 0 nM (black), 19.5 nM (blue), 625 nM (cyan), 5,000 nM (orange), and 20,000 nM (red). Gray dashed lines indicate ΔTm. (C) F-STX diagram. STX and fluorescein (F) moieties are highlighted in blue and yellow, respectively. (D) Exemplar FP binding curves and Kds for RcSxph and the indicated mutants. (E) Comparison of RcSxph mutant ΔTm and ΔΔG values (line y = 3.49 –0.7523x, R2 = 0.886). (F) Exemplar isotherms for titration of 100 µM STX into 10 µM RcSxph. 100 µM STX into 10 µM RcSxph F561A, 100 µM STX into 10 µM RcSxph E540D, and 300 µM STX into 30 µM RcSxph D794E. Kd and ΔH values are indicated. (G) Comparison of ΔGITC for STX and ΔGFP for F-STX for RcSxph and mutants. Purple box highlights region of good correlation. Orange box indicates region outside of the ITC dynamic range. (line shows x = y). Colors in B, D, and E correspond to classifications in Table 1.

