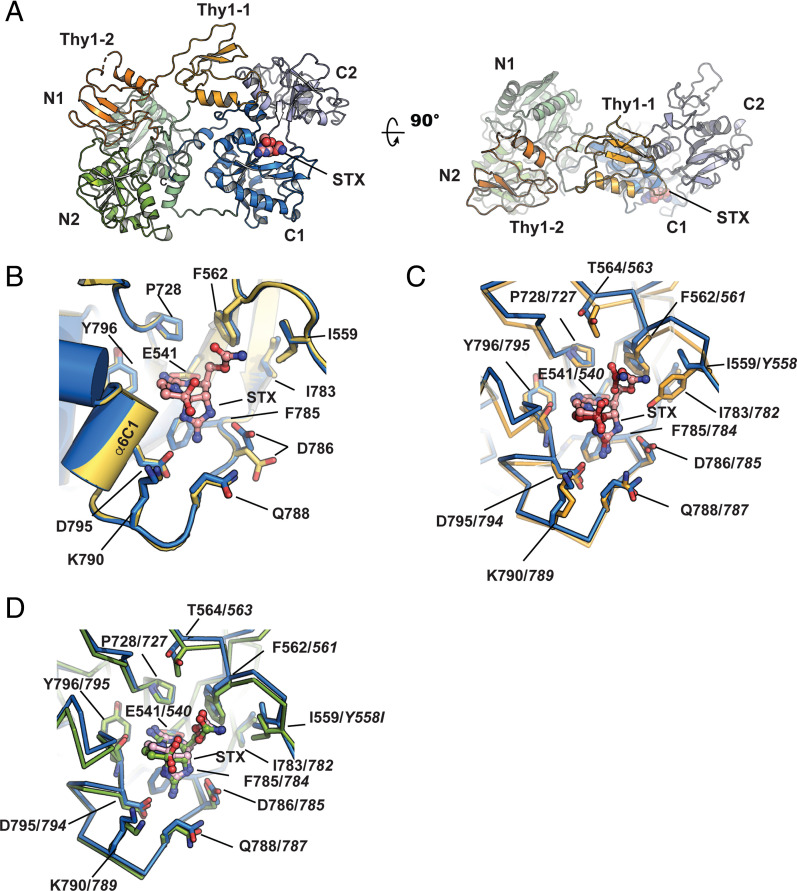
Fig. 6.
NpSxph and NpSxph:STX structures. (A) Cartoon diagram of the NpSxph:STX complex. N1 (light green), N2 (green), Thy1-1 (light orange), Thy1-2 (orange), C1 (marine), and C2 (light blue) domains are indicated. STX (pink) is shown in space-filling representation. (B) Comparison of STX binding pocket for apo-NpSxph (yellow) and NpSxph:STX (marine). STX (pink) is shown as ball and stick. (C) Comparison of NpSxph (marine) and RcSxph (orange) (PDB ID:6O0F) (10) STX binding sites. STX from NpSxph and RcSxph complexes is pink and orange, respectively. (D) Comparison of NpSxph (marine) and RcSxph-Y558I (split pea) STX binding sites. STX from NpSxph and RcSxph-Y558I complexes is pink and split pea, respectively. RcSxph and RcSxph-Y558I residue numbers in C and D are indicated in italics.

