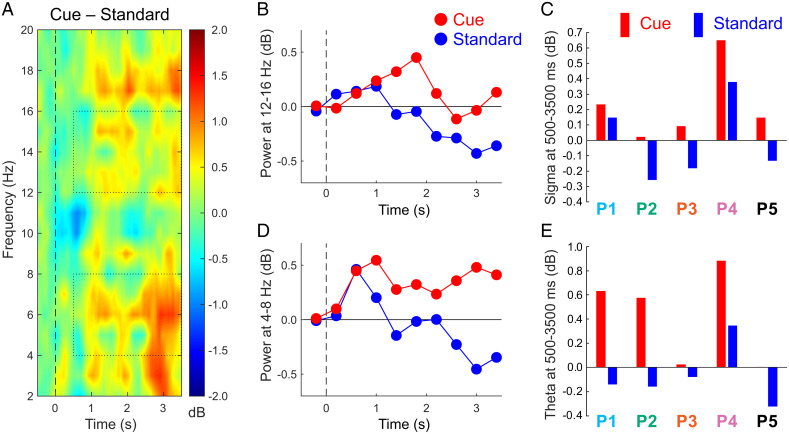
Fig. 2.
Responses to cue and standard sounds from the MTL cluster. (A) Time–frequency plot of the cue–standard differential response across all patients. Dotted rectangles indicate the data used for evaluating responses in the sigma and theta bands, focusing on the interval from 500 to 3,500 ms. (B) Sigma measures over consecutive 400-ms intervals, centered over each interval. (C) Sigma measures over the poststimulus epoch for individual patients. (D) Theta measures over consecutive 400-ms intervals. (E) Theta measures over the poststimulus epoch for individual patients.

