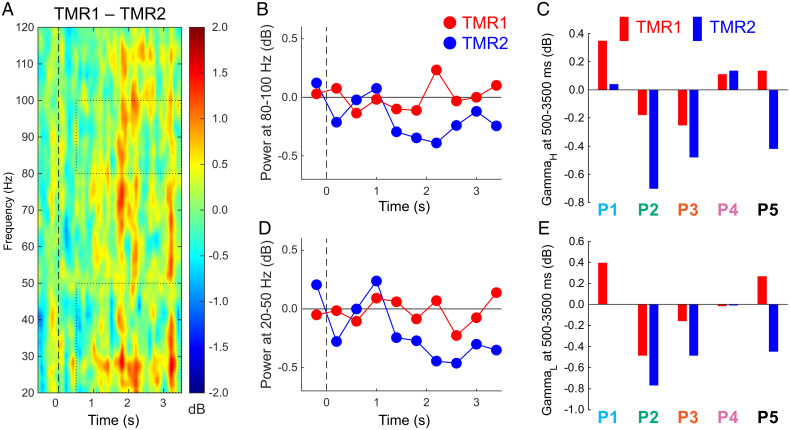
Fig. 3.
Responses to sounds at 20 to 120 Hz for two subtypes of the cued condition (larger memory improvement for TMR1 than TMR2). (A) Differential responses as a function of memory change (for display purposes, data were smoothed by averaging over 70-ms periods). Dotted rectangles indicate the data used for evaluating responses in two gamma bands, focusing on the interval from 500 to 3,500 ms. (B) GammaH measures over consecutive 400-ms intervals. (C) GammaH measures over the poststimulus epoch for individual patients. (D) GammaL measures over consecutive intervals. (E) GammaL measures over the poststimulus epoch for individual patients.

