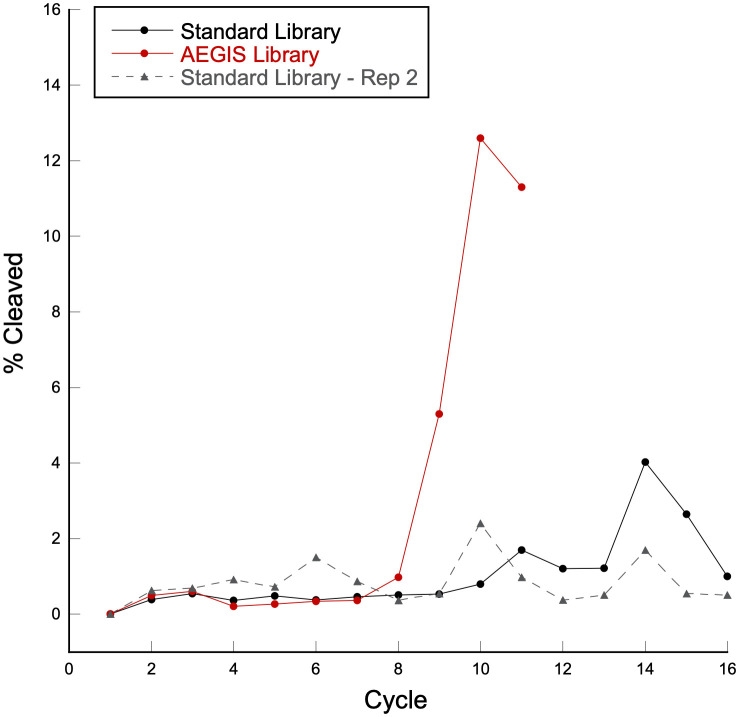
Fig. 2.
AEGIS versus standard RNA-cleaving DNAzyme selection progression. Plot of percent of molecules released in solution (“% cleaved”) versus cycle No. Red dots, solid line: in vitro selection with AEGIS library; black dots, solid line: in vitro selection with standard library; gray triangles, dashed line: second in vitro selection with standard library with switched primers.

