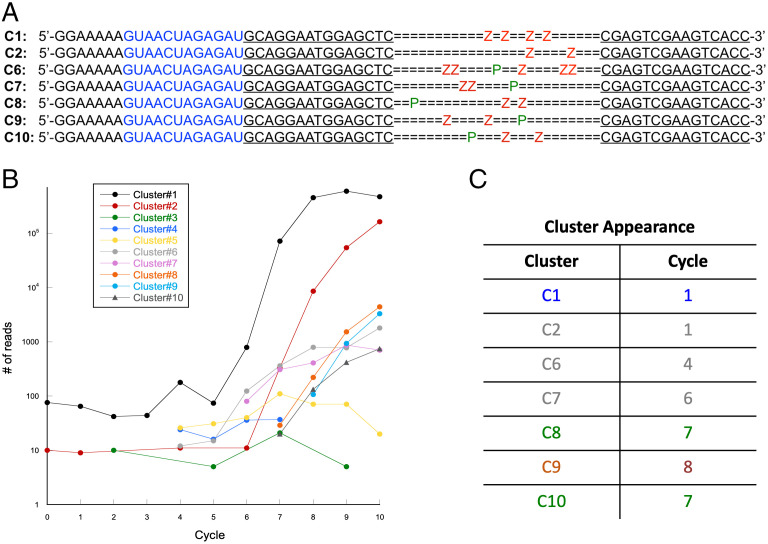
Fig. 3.
Sequences and appearance of clusters during AEGIS DNAzyme selection. (A) Schematic representation of cluster sequences. In blue: RNA target; underlined: primer binding regions. Locations of AEGIS P (green) and Z (red) are marked. (B) Plot of sequence abundance (expressed as No. of reads) versus selection cycle. (C) Table of cluster appearance color coded by type of cleavage. Blue: type 1, green: type 2, red: type 3 (see text for details), gray: no apparent cleavage.

