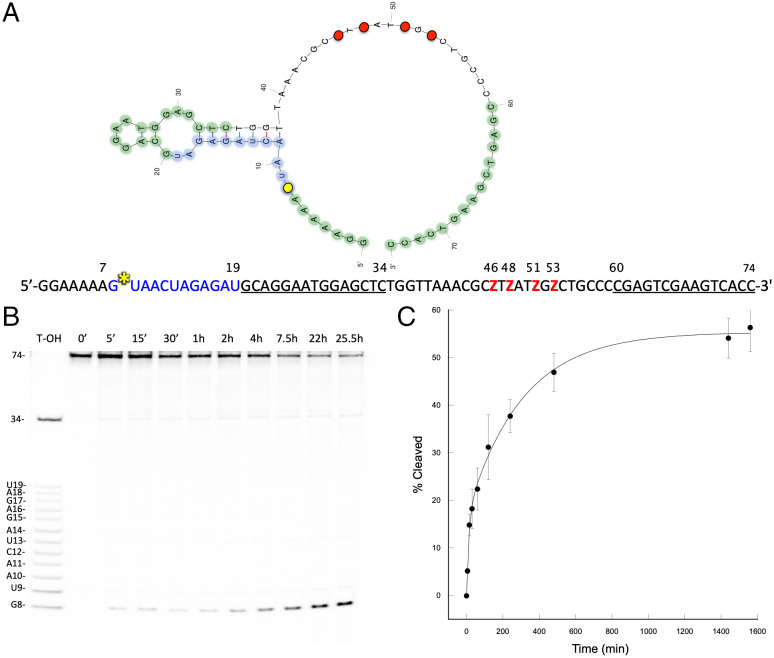
Fig. 5.
Cluster 1 AEGISzyme cleavage. (A) Two-dimensional rendering of AEGISzyme C1 generated with mfold (60) and RNA/DNA construct primary sequence. RNA target in blue, binding sites in green and underlined, Zs in red, and cleavage site in yellow. The RNA:DNA duplex portion of the molecule was confirmed by enzymatic digestion. (B) Denaturing 18% PAGE of cleavage reaction time course, with time points marked in minutes (‘) and hours (h). RNA bases and sizes in nucleotides are indicated on the Left. (C) Plot of percent cleavage versus time in minutes. Data were fitted to a double exponential equation. Data points represent the mean value of at least three replicates.

