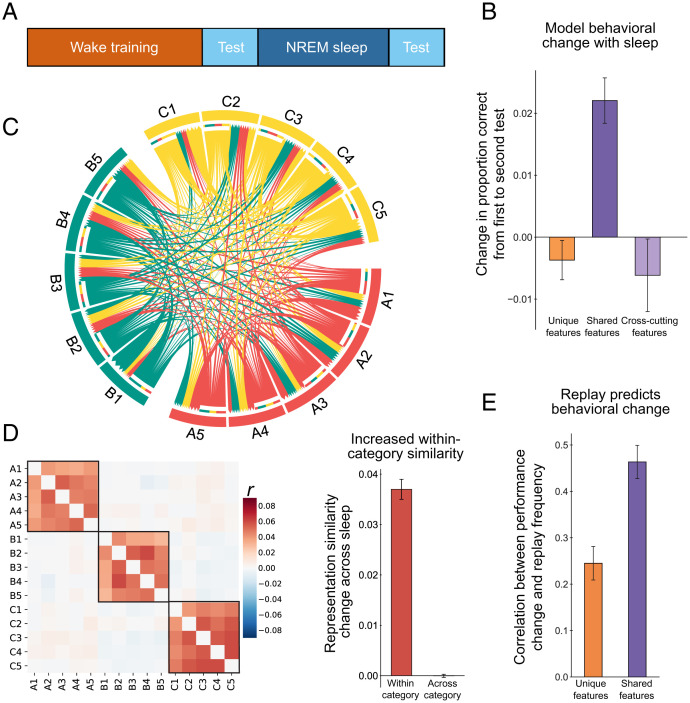
Fig. 3.
Simulation 1: Category learning consolidation across one night of sleep. (A) Simulation protocol. (B) Change in full model performance from before to after sleep for unique features, shared features, and cross-cutting features. (C) Chord plot of replay transitions, with A, B, and C indicating categories. Arrow base indicates transition initiation, and head indicates termination. Arrow width indicates proportion of replays for a given satellite. The plot shows that replay was interleaved uniformly across exemplars (with a modest preference for within-category transitions). (D) (Left) Change in pairwise correlation of neocortical representations across items from before to after sleep. Black boxes indicate within-category changes. (Right) Averaged pairwise correlation change of neocortical representations within and across categories. (E) Fisher-transformed correlation between exemplar replay frequency during sleep and performance change, averaged across model initializations. All error bars represent ±1 SEM across network initializations.

