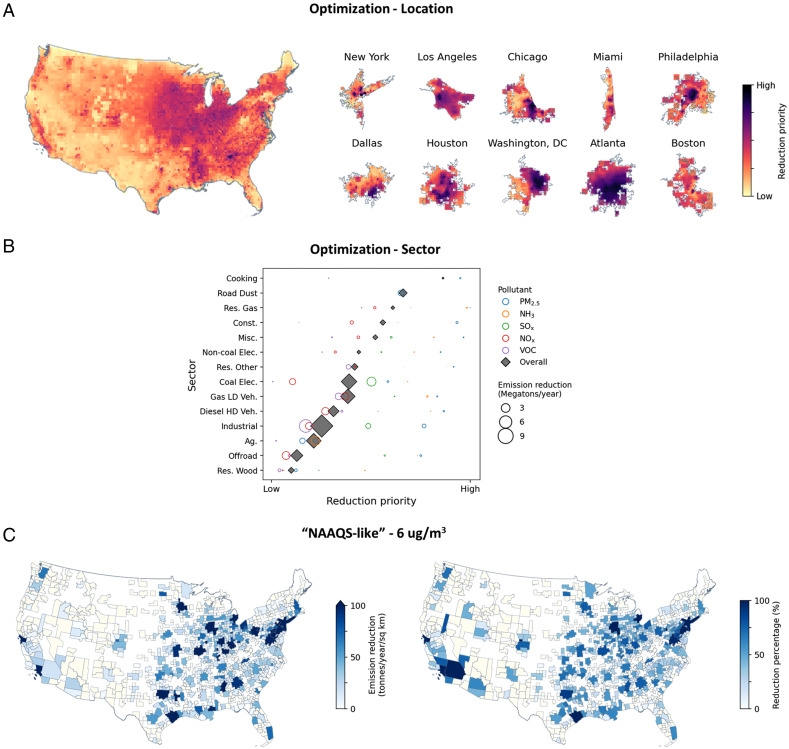
Fig. 2.
Emission reductions for the three approaches: by location (i.e., corresponding to the green lines, Fig. 1) (A), by sector (corresponding to blue lines, Fig. 1) (B), and NAAQS-like (orange lines, Fig. 1) (C). A displays national results (Left) and zoomed-in results for 10 large areas (Right). Spatial units displayed in C are CBSAs, the geographic unit for NAAQS evaluation. The three approaches offer fundamentally different ways of formulating and prioritizing emission reductions. Ag., agriculture; Const., construction; Elec., electricity; HD, heavy duty; LD, light duty; Misc., miscellaneous; Res., residential; Veh., vehicle.

