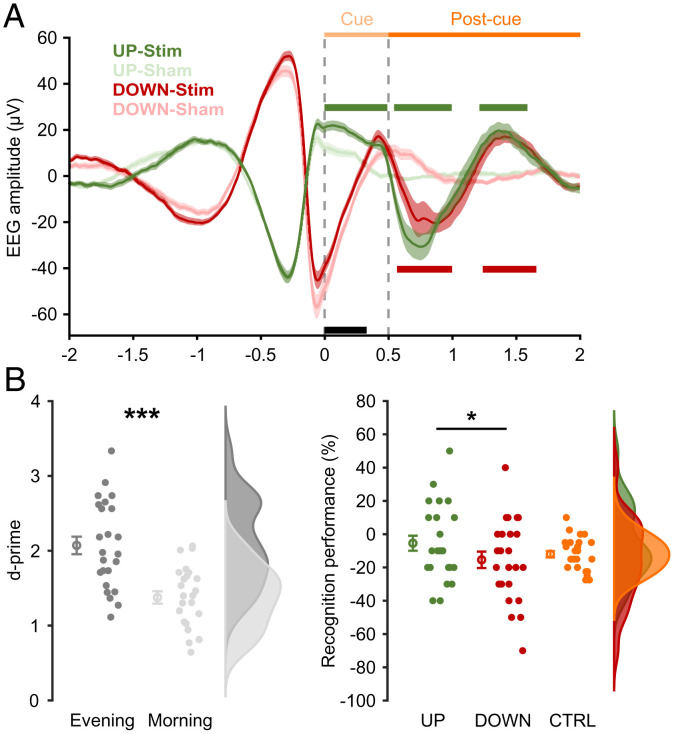
Fig. 2.
EEG and behavioral effects of UP state– vs. DOWN state–triggered TMR. (A) ERPs at Cz for the UP-Stim (green) and DOWN-Stim (red) and respective “sham” conditions (light colors). All data are shown as mean ± SEM across participants. Vertical dashed lines depict the onset and offset of TMR cues. Light and dark orange horizontal lines mark the cue and a postcue interval, respectively. The black horizontal line marks significant differences between UP- vs. DOWN-Stim conditions, the green horizontal line marks significant differences between UP-Stim vs. UP-Sham, and the red horizontal line marks significant differences between DOWN-Stim vs. DOWN-Sham (all P < 0.05, corrected; statistical analysis was performed for time of >0). Note that detection thresholds were based on data from Fz. (B) General assessment of memory performance based on old/new recognition of verbs as d prime. The rain cloud plot depicts the performance of individual participants alongside data distributions (Right). Circles with error bars show mean ± SEM across participants. Dark gray indicates presleep (evening), and light gray indicates postsleep (morning). (C) Overnight change in verb recognition associated with SO UP-state cueing (green), SO DOWN-state cueing (red), or no cueing (CTRL; orange). The same plotting conventions as in B are used. *P < 0.05; ***P < 0.001.

