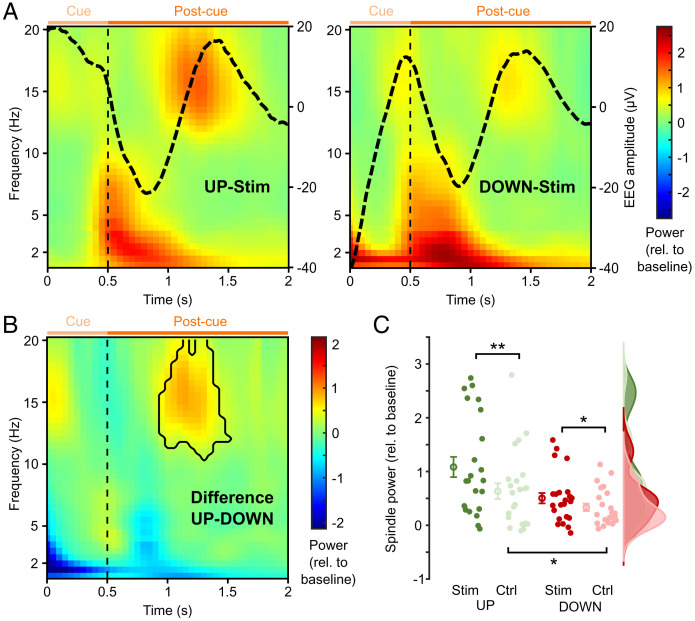
Fig. 3.
Greater spindle activity after SO UP-state cueing. (A) TFRs at Cz for the UP-Stim (Left) and DOWN-Stim (Right) conditions calculated time locked to the cue onset for frequencies between 1 and 20 Hz with the corresponding ERP superimposed (black lines; right y axis). The color bar indicates the relative change in power to a baseline interval from −2.5 to −2 s. Vertical dashed lines depict the offset of TMR cues. Light and dark orange horizontal lines mark the cue and postcue interval, respectively. (B) TFR showing the difference between UP-Stim and DOWN-Stim conditions as shown in A. The black contour outlines significant time-frequency clusters (P < 0.05, corrected; statistics were conducted from 10 to 20 Hz). (C) Rain cloud plot for power corresponding to the significant cluster shown in B for the UP-Stim (dark green), DOWN-Stim (dark red), and their respective control (Ctrl) conditions (novel sound; light colors). Circles with error bars show mean ± SEM across participants. Extended channel × time × frequency analyses are shown in SI Appendix, Fig. S2. *P < 0.05; **P < 0.01.

