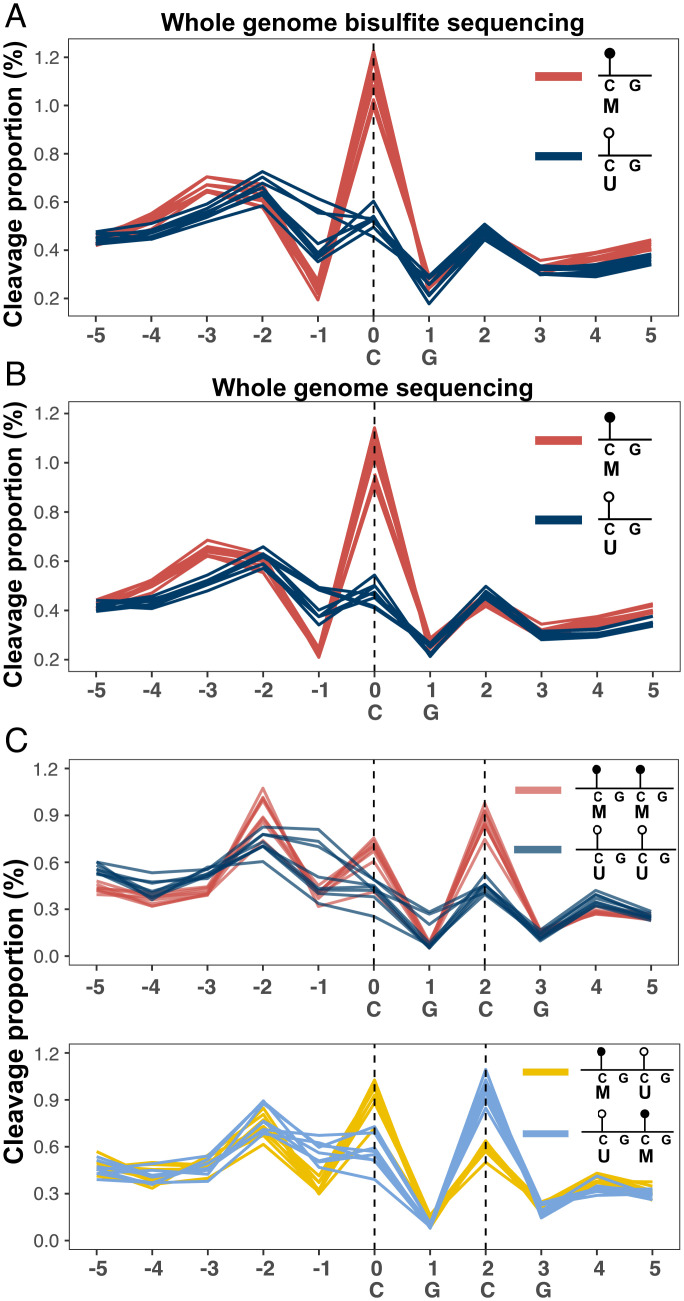
Fig. 2.
Cleavage proportion depending on CpG methylation status. (A) Cleavage profiles related to hypermethylated (red lines) and hypomethylated (blue lines) CpGs in plasma DNA of eight healthy controls based on whole-genome bisulfite sequencing data. Each line represents one sample. (B) Cleavage profiles related to hypermethylated (red lines) and hypomethylated (blue lines) CpGs in plasma DNA of eight healthy controls based on whole-genome nonbisulfite sequencing data. Each line represents one sample. (C) Cleavage profiles in windows each containing two tandem CpG dinucleotides spanning positions 0, 1, 2, and 3 (i.e., CGCG subsequence) in plasma DNA of eight healthy controls. Red, dark blue, yellow, and light blue lines correspond to the cleavage profiles with different methylation configurations of two immediately adjacent CpG sites: “MM,” “UU,” “MU,” and “UM,” where M and U represent hypermethylated and hypomethylated states, respectively.

