Fig. 3.
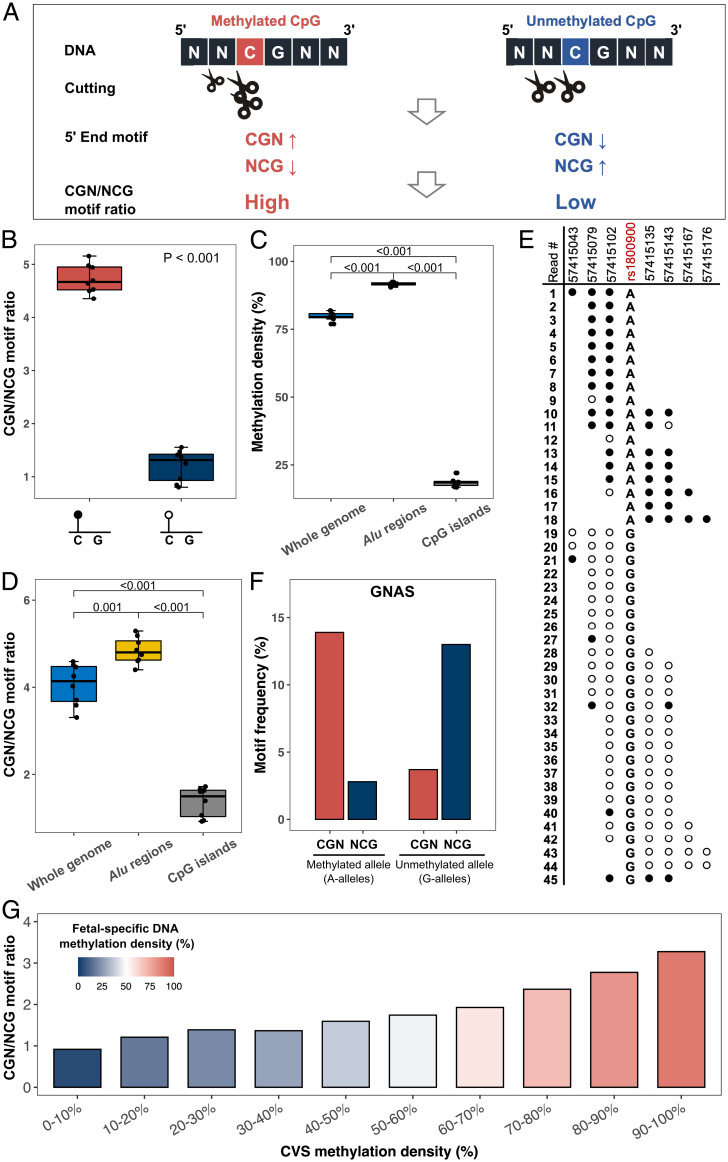
CGN/NCG motif ratio analysis. (A) Illustration of the biological principle for CGN/NCG motif ratio. A methylated CpG confers a higher cleavage probability at the cytosine of the CpG context but a lower cleavage probability at one base before the CpG context, compared with an unmethylated CpG. Such differential cutting leads to an increase of CGN motifs but a decrease of NCG motifs. Therefore, we expected to observe higher CGN/NCG motif ratios on hypermethylated CpG sites compared to those on hypomethylated CpGs. (B) Box plot of CGN/NCG motif ratio between hypermethylated and hypomethylated CpGs from plasma DNA of eight healthy control samples. (C) Methylation density of cfDNA molecules measured by bisulfite sequencing across the whole genome, Alu regions, and CpG islands from eight healthy control samples, respectively. (D) CGN/NCG motif ratios of whole genome, Alu regions, and CpG islands, respectively. (E) Methylation status of sequenced fragments mapped to an imprinting region (GNAS gene, located at chr20:57,415,043–57,415,176). Each row with the back (methylated) and white (unmethylated) dots represents one plasma DNA molecule. Each dot represents one CpG site. Two groups of sequenced fragments carried A alleles and G alleles, respectively, at an SNP (rs1800900). cfDNA molecules carrying A-alleles are methylated while those with G-alleles are unmethylated. (F) The frequencies of CGN and NCG motifs related to the imprinting region. (G) The CGN/NCG motif ratios from fetal-specific cfDNA in maternal plasma DNA (first trimester) correlated with the methylation levels in the paired chorionic villus sampling (CVS) biopsy. CpGs were grouped into 10 groups according to the methylation levels from the paired CVS biopsy. The y axis represents the CGN/NCG motif ratio of fetal-specific cfDNA, and the graded colors in the bars represent the different methylation densities of fetal-specific cfDNA.

