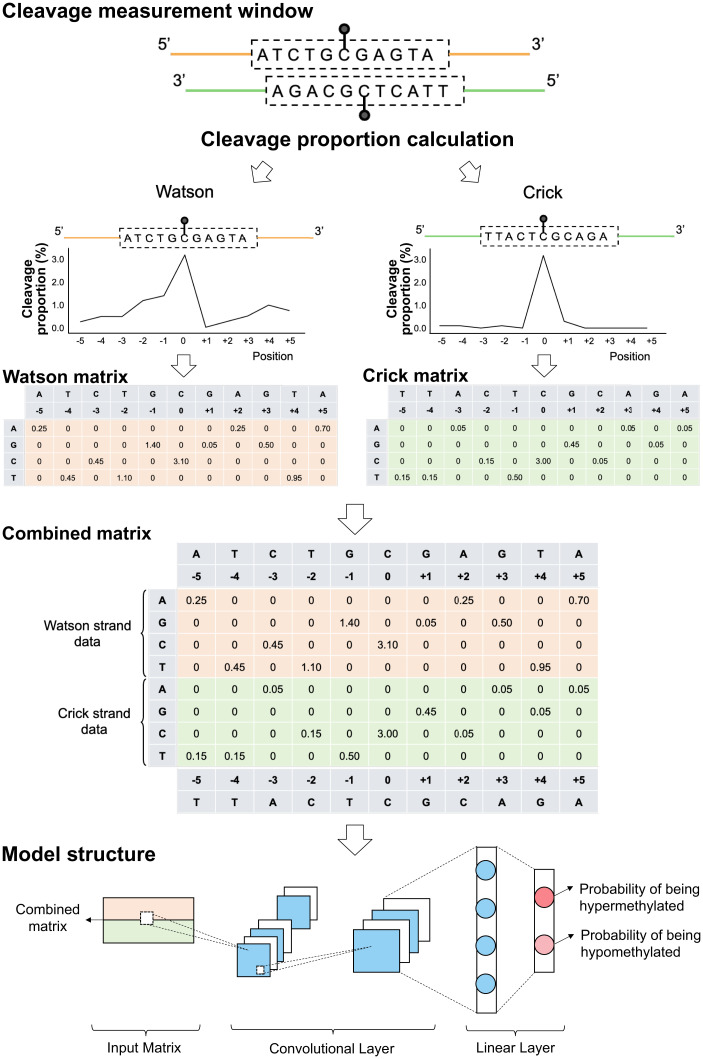
Fig. 8.
Schematic for methylation status prediction at single CpG resolution using a CNN model based on cleavage profiles. For illustration purposes, the 5 nt upstream (e.g., ATCTG) and 5 nt downstream (e.g., GAGTA) of the cytosine at a CpG site (i.e., the cleavage measurement window) being analyzed were presented as 5′-[ATCTG]C[GAGTA]-3′ for the Watson strand. The relative positions of this sequence corresponded to −5, −4, −3, −2, −1, 0, +1, +2, +3, +4, and +5, respectively. The central position 0 corresponded to the cytosine at the CpG site that was subjected to the methylation analysis. The cleavage proportion for each position was constructed into a 2-D matrix according to the sequence context. For instance, for a position of −1 corresponding to the base of guanine (G), the cleavage proportion associated with G (1.40) was filled in the corresponding cell between a column of −1 and a row of G. The remaining rows corresponding to A, C, and T in the Watson strand were filled by 0. The cleavage profiles and sequence context originating from the Crick strand (‘5-[TTACT]C[GCAGA]-3′) were processed similarly. The data matrices from the Watson and Crick strand were put together into a combined matrix to train and test a CNN model.

