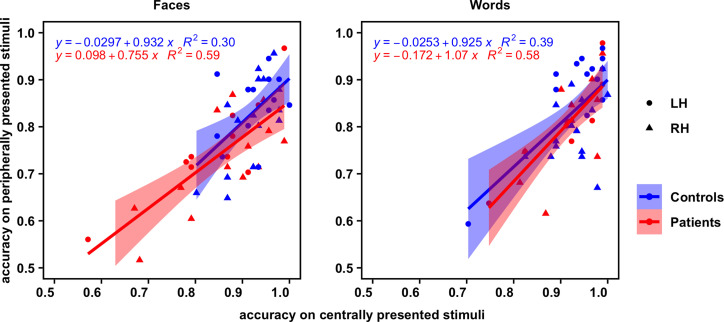
Fig. 4.
Correlation plots displaying each participant's accuracy on experiment 2 (peripheral stimulus presentation; y axis) versus accuracy on experiment 1 (central stimulus presentation; x axis) for faces (Left) and words (Right). The regression line of best fit for each group is overlaid, with 95% confidence intervals.

