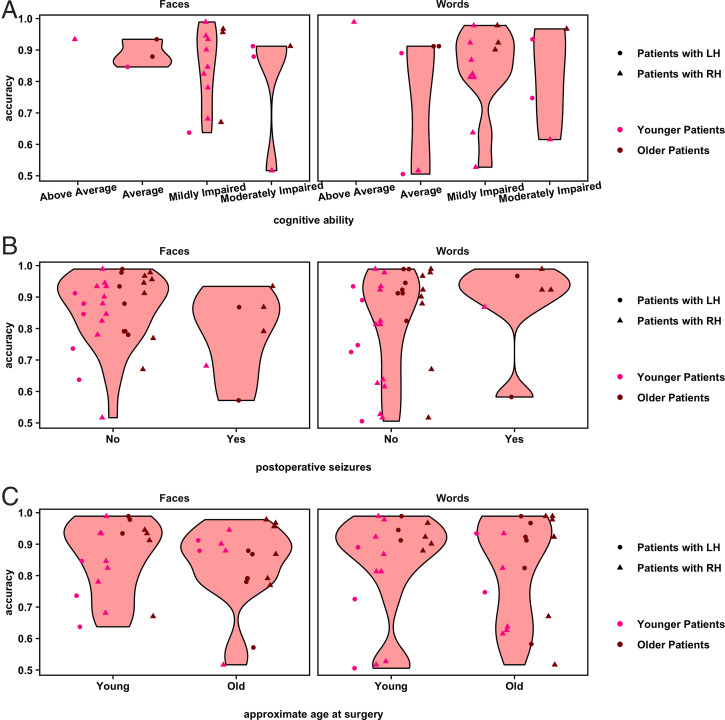
Fig. 5.
Violin plots show the distribution of overall accuracy values on the face and word recognition tasks for patients, separated by levels of conceivable predictors (per participant and/or guardian report). (A) Cognitive ability. (B) Occurrence of any seizures after patients' most recent surgery. (C) Approximate age at surgery (5 y and younger versus 6 y and older). Some patients underwent multiple surgeries prior to or to complete their hemispherectomy: Age at final surgery was used here. Overlaid point plots show the individual values for each participant. To visualize any effect of age at the time of testing of the study, individual participants' points are separated by the median of the age distribution for all participants in the study (younger versus older than 17.5 y), shown in different shades of red. Points are randomly jittered to minimize overlapping data. Note: Axes begin at accuracy = 0.5 because cases in which a participant performed at or below chance on a task were excluded from the analysis.

