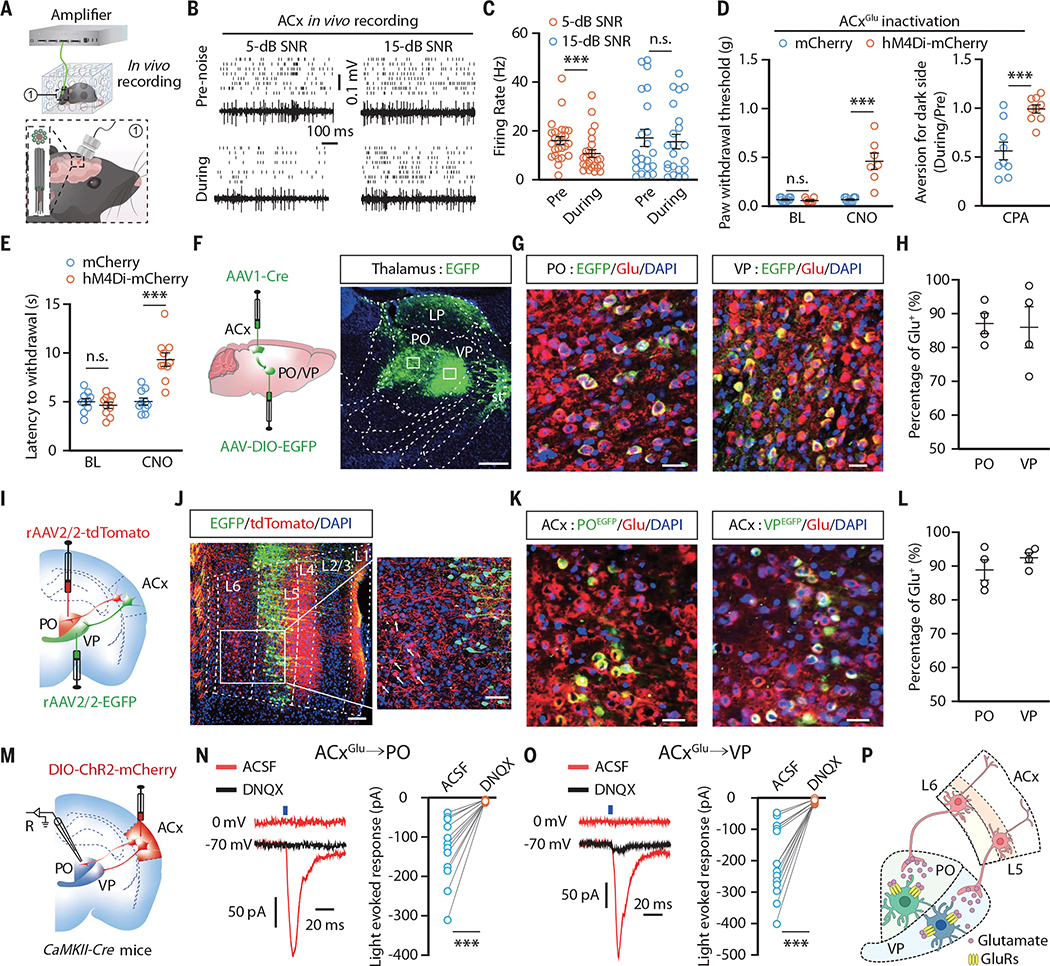
Fig. 2. ACxGlu neurons project to VPGlu and POGlu neurons.
(A) Schematic for multitetrode recording in freely moving mice. (B and C) Raster plots and voltage traces of the spontaneous firings recorded in the ACx (B) and summarized data (5-dB SNR, n = 25 cells from four mice; 15-dB SNR, n = 22 cells from four mice; P = 0.0053) (C). (D and E) Summarized data for the mechanical nociceptive threshold (mCherry, n = 10 mice; hM4Di-mCherry, n = 8 mice; BL, P = 0.3816; CNO, P < 0.0001) [(D), left], place aversion (n = 9 mice each group; P = 0.0006) [(D), right], and thermal nociceptive threshold (n = 10 mice each group; P < 0.0001) (E) in CFA mice upon chemogenetic inhibition of ACxGlu neurons. (F) Schematic for anterograde tracing and representative image of EGFP-expressing neurons in the PO and VP. Scale bar, 500 μm. LP, lateral posterior thalamic nucleus; st, stria terminalis. (G and H) Representative images showing the colocalization of EGFP-labeled neurons with glutamate (Glu) immunofluorescence (G) and summarized data (n = 4 slices) (H). Scale bars, 50 μm. DAPI, 4’,6-diamidino-2-phenylindole. (I) Schematic for retrograde tracing. (J) Representative images showing EGFP+ and tdTomato+ neurons in the ACx. Scale bars, 100 μm. (K and L) Representative images of the colocalization of EGFP-labeled PO- and VP-projecting ACx neurons with glutamate immunofluorescence (K) and summarized data (n = 4 slices) (L). Scale bars, 50 μm. (M) Schematic for viral injection and whole-cell recordings. R, recording. (N and O) Representative traces and summarized data for light-evoked postsynaptic currents recorded in PO neurons (n = 12 cells from four mice; P = 0.0002) (N) and VP neurons (n = 14 cells from four mice; P < 0.0001) (O). ACSF, artificial cerebrospinal fluid; DNQX, 6,7-dinitroquinoxaline-2,3-dione. (P) A model of ACxGlu→PO and ACxGlu→VP circuits. GluRs, glutamate receptors. The data are expressed as the means ± SEMs. ***P < 0.001; n.s., not significant. Details of the statistical analyses are presented in table S1.

