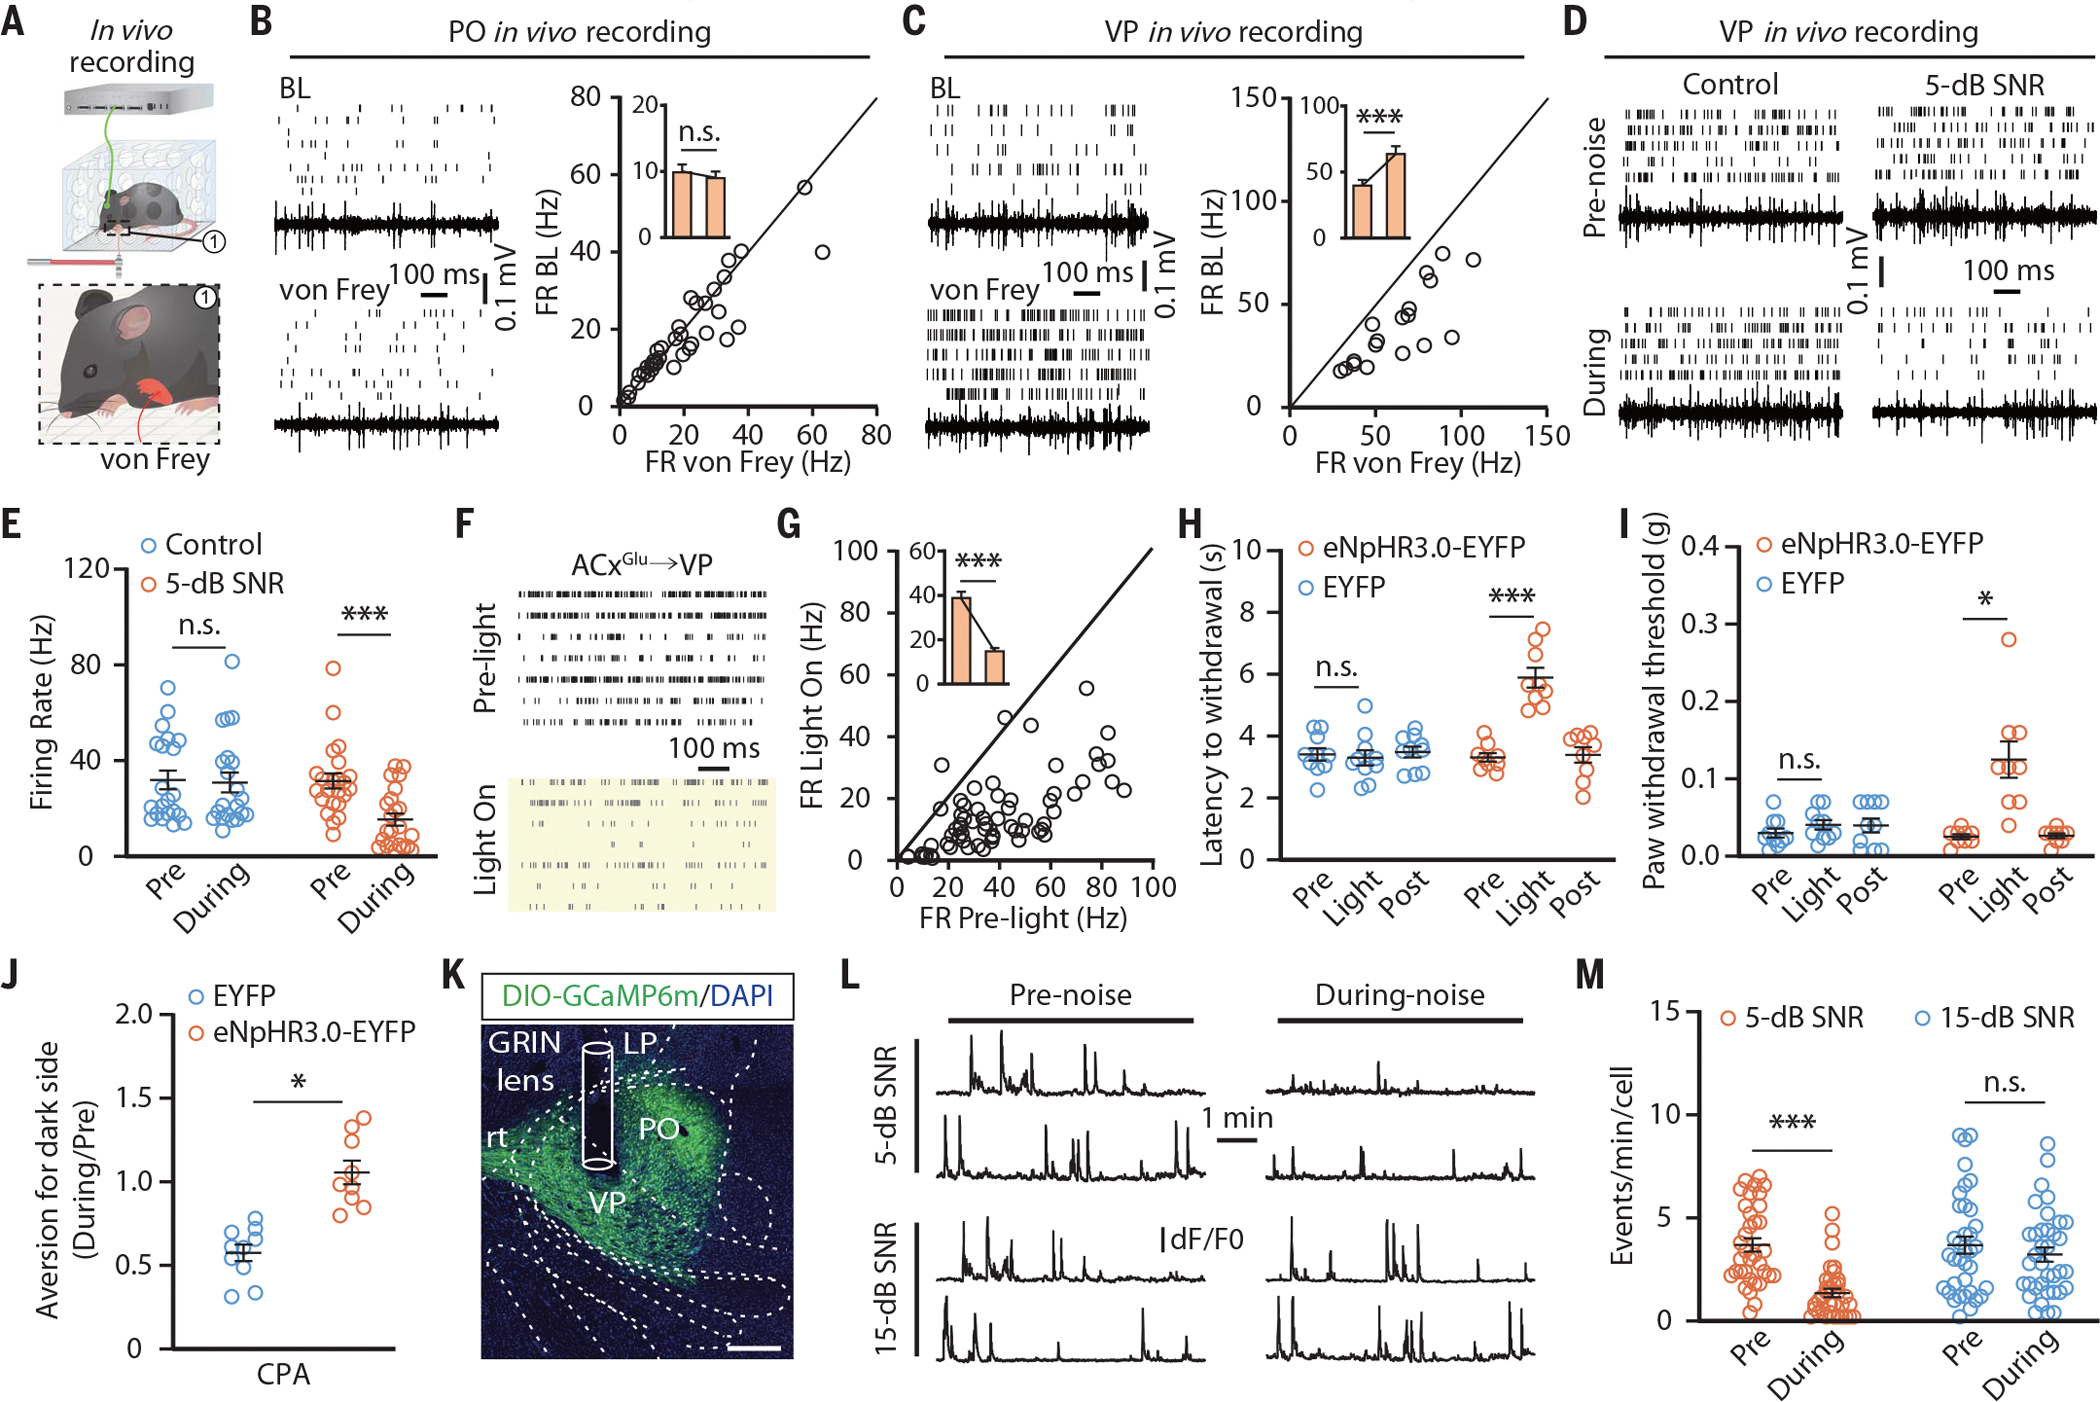
Fig. 4. Inhibition of the ACxGlu→VP circuit mediates low-SNR sound-induced analgesia on forepaws.

(A) Schematic for multitetrode recording in the VP or PO of freely moving mice. (B and C) Raster plots, voltage traces, and summarized data for the spontaneous firings recorded in PO neurons (n = 36 cells from four mice; t35 = 1.749; P = 0.089) (B) and VP neurons (n = 18 cells from four mice; t17 = 7.373; P < 0.0001) (C) before and during punctate mechanical stimulation (von Frey filament, 0.02 g) of inflamed forepaws. (D and E) Raster plots and voltage traces of the spontaneous firings recorded in VP neurons from CFA mice with or without 5-dB SNR white noise exposure (D) and summarized data (control, n = 21 cells from four mice; 5-dB SNR, n = 23 cells from four mice; F1,42 = 24.18; P < 0.0001) (E). (F and G) Raster plots of the spontaneous activity recorded in VP neurons before and during optical inhibition of the ACxGlu→VP circuit in CFA-treated mice (F) and summarized data (n = 67 cells from seven mice; t66 = 12.14; P < 0.0001) (G). (H to J) Summarized data for the thermal (EYFP, n = 10 mice; eNpHR3.0-EYFP, n = 9 mice; F2,34 = 20.98; P < 0.0001) (H) and mechanical (EYFP, n = 10 mice; eNpHR3.0-EYFP, n = 9 mice; F2,34 = 13.25; P < 0.0001) (I) nociceptive thresholds of CFA-injected forepaws and place aversion (EYFP, n = 10 mice; eNpHR3.0-EYFP, n = 9 mice; t17 = 5.648; P < 0.0001) (J) upon optical inhibition of the ACxGlu→VP circuit. (K) A typical image of GCaMP6m fluorescence and track of the lens in the VP. Scale bar, 200 μm. (L and M) Representative traces (L) of spontaneous Ca2+ signals recorded in VP neurons receiving ACx projections and summarized data (5-dB SNR, n = 35 cells from four mice; 15-dB SNR, n = 36 cells from four mice; F1,69 = 24.24; P < 0.0001) (M). The data are expressed as the means ± SEMs. *P < 0.05; ***P < 0.001; n.s., not significant. Details of the statistical analyses are presented in table S1.
