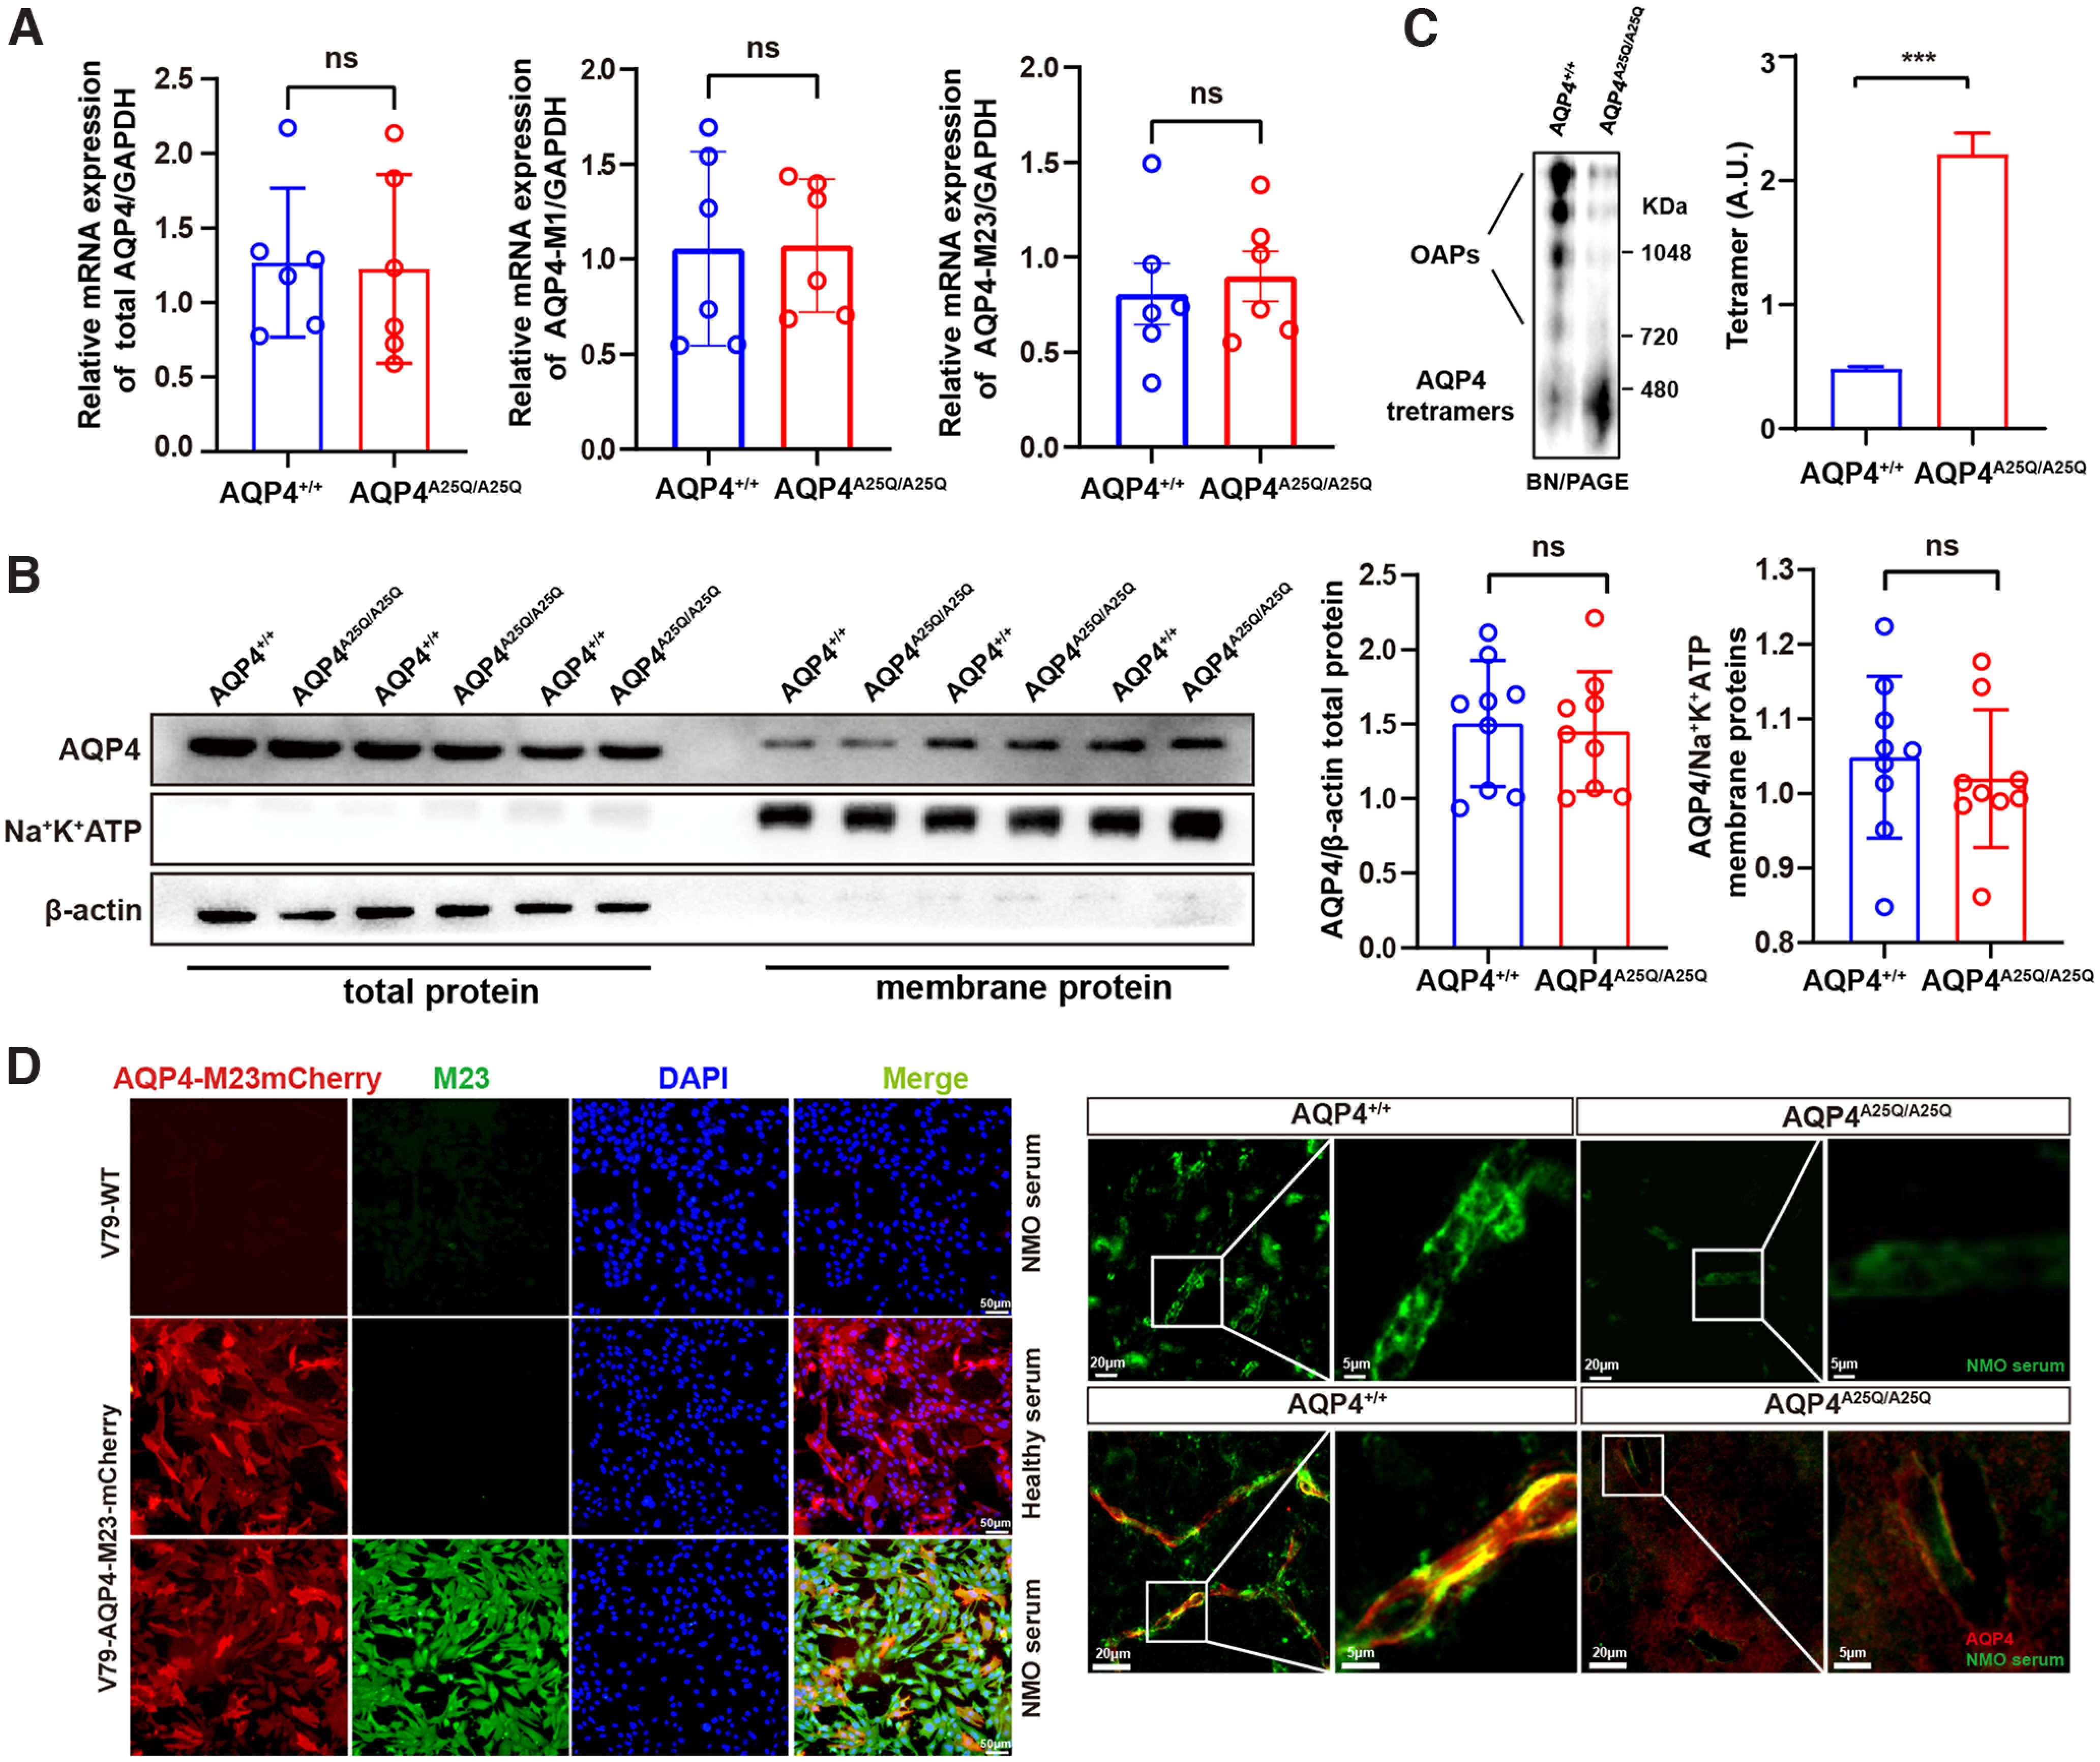
Figure 2.

Effects of A25Q mutation on AQP4 expression and OAP formation in the brains of AQP4A25Q/A25Q mice. A, Densitometry analysis of the mRNA levels of total AQP4, AQP4-M1, and AQP4-M23 in AQP4+/+ and AQP4A25Q/A25Q mouse brains. n = 6 mice for each group. Primers used are provided in Extended Data Table 1-1. B, Representative bands and densitometry analysis of the AQP4 total protein and the AQP4 membrane protein expression level in AQP4+/+ and AQP4A25Q/A25Q mouse brains. n = 9 mice for each group. C, AQP4 immunoblot of brain tissues following BN–PAGE, and bar graph represents the results of densitometry analysis of AQP4 tetramers, which was shown in arbitrary units (A.U.). n = 3 mice for each group. D, Left, Live V79-AQP4-M23-mCherry cells and V79-WT cells (without AQP4-M23 expression) exposed to NMO patient serum. Scale bar, 50 μm. Right, immunofluorescence pattern of bound NMO serum and AQP4 antibody in the mouse CNS. Scale bars: top, 20 μm, 5 μm; bottom, 20 μm, 5 μm. ***p < 0.001 (Mann–Whitney test and unpaired Student's t test). Bar graphs indicate mean ± SD. Antibodies used are provided in Extended Data Table 2-1.
