Figure 3.

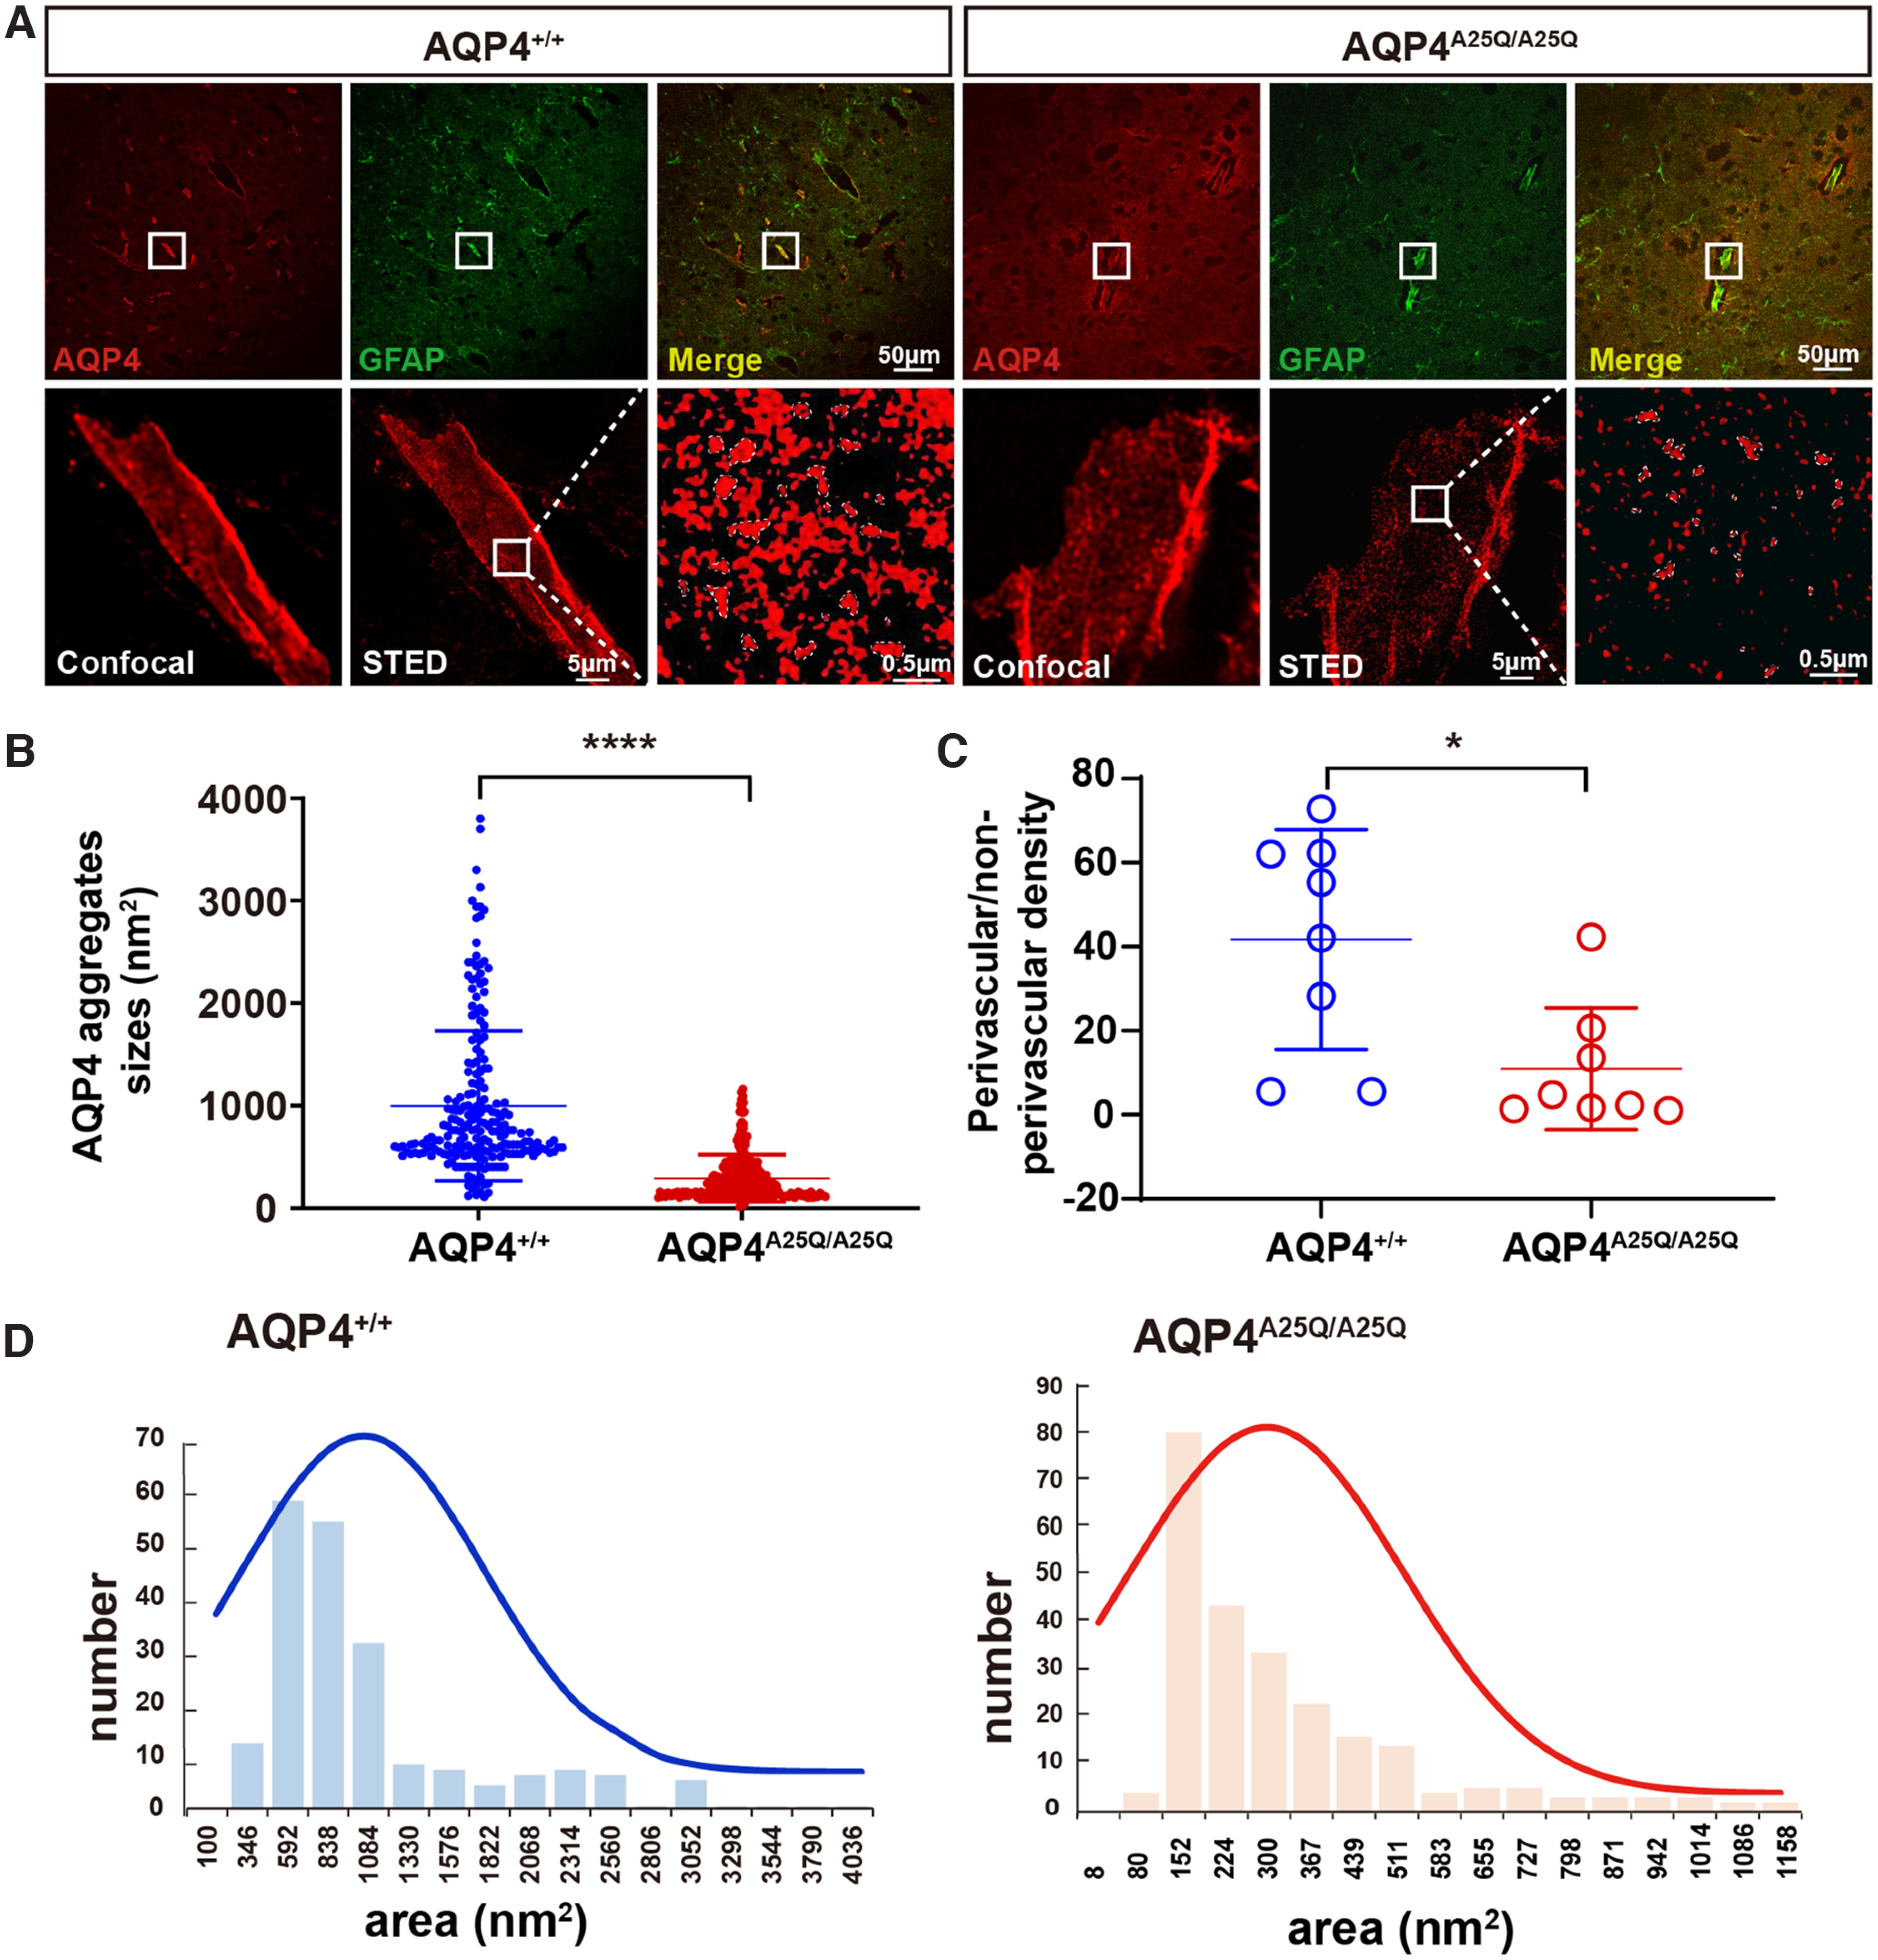
AQP4-A25Q mutation modulates supramolecular clustering of AQP4. A, Brain blood vessel stained with commercial anti-AQP4 and anti-GFAP antibodies and imaged using confocal microscopy and g-STED. Top, The typical staining of AQP4 astrocyte processes surrounding brain cortex capillaries is shown in the white box. Scale bar: 50 μm. Bottom, a comparison of confocal and g-STED imaging, with magnification of the white-boxed region indicated by g-STED. Scale bars: 5 μm, 0.5 μm. B, Analysis of AQP4 clusters was performed in AQP4+/+ and AQP4A25Q/A25Q mice. Scatter plot of AQP4 cluster sizes measured from the intensity profiles by the FWHM intensity. n = 214 clusters for the AQP4+/+ group; n = 247 clusters for the AQP4A25Q/A25Q group. C, Quantification of the ratio of AQP4 staining density in GFAP-labeled processes adjacent to blood vessels versus nonadjacent processes was performed in AQP4+/+ and AQP4A25Q/A25Q mice. n = 8 mice for each group. D, The size distributions of OAPs were also different, measuring 291.7 ± 14.6 nm2 in AQP4A25Q/A25Q mice and 998.7 ± 50.0 nm2 in AQP4+/+ mice on average. B, C, Data are median ± SD. *p < 0.05; ****p < 0.0001; Mann–Whitney test.
