Figure 6.

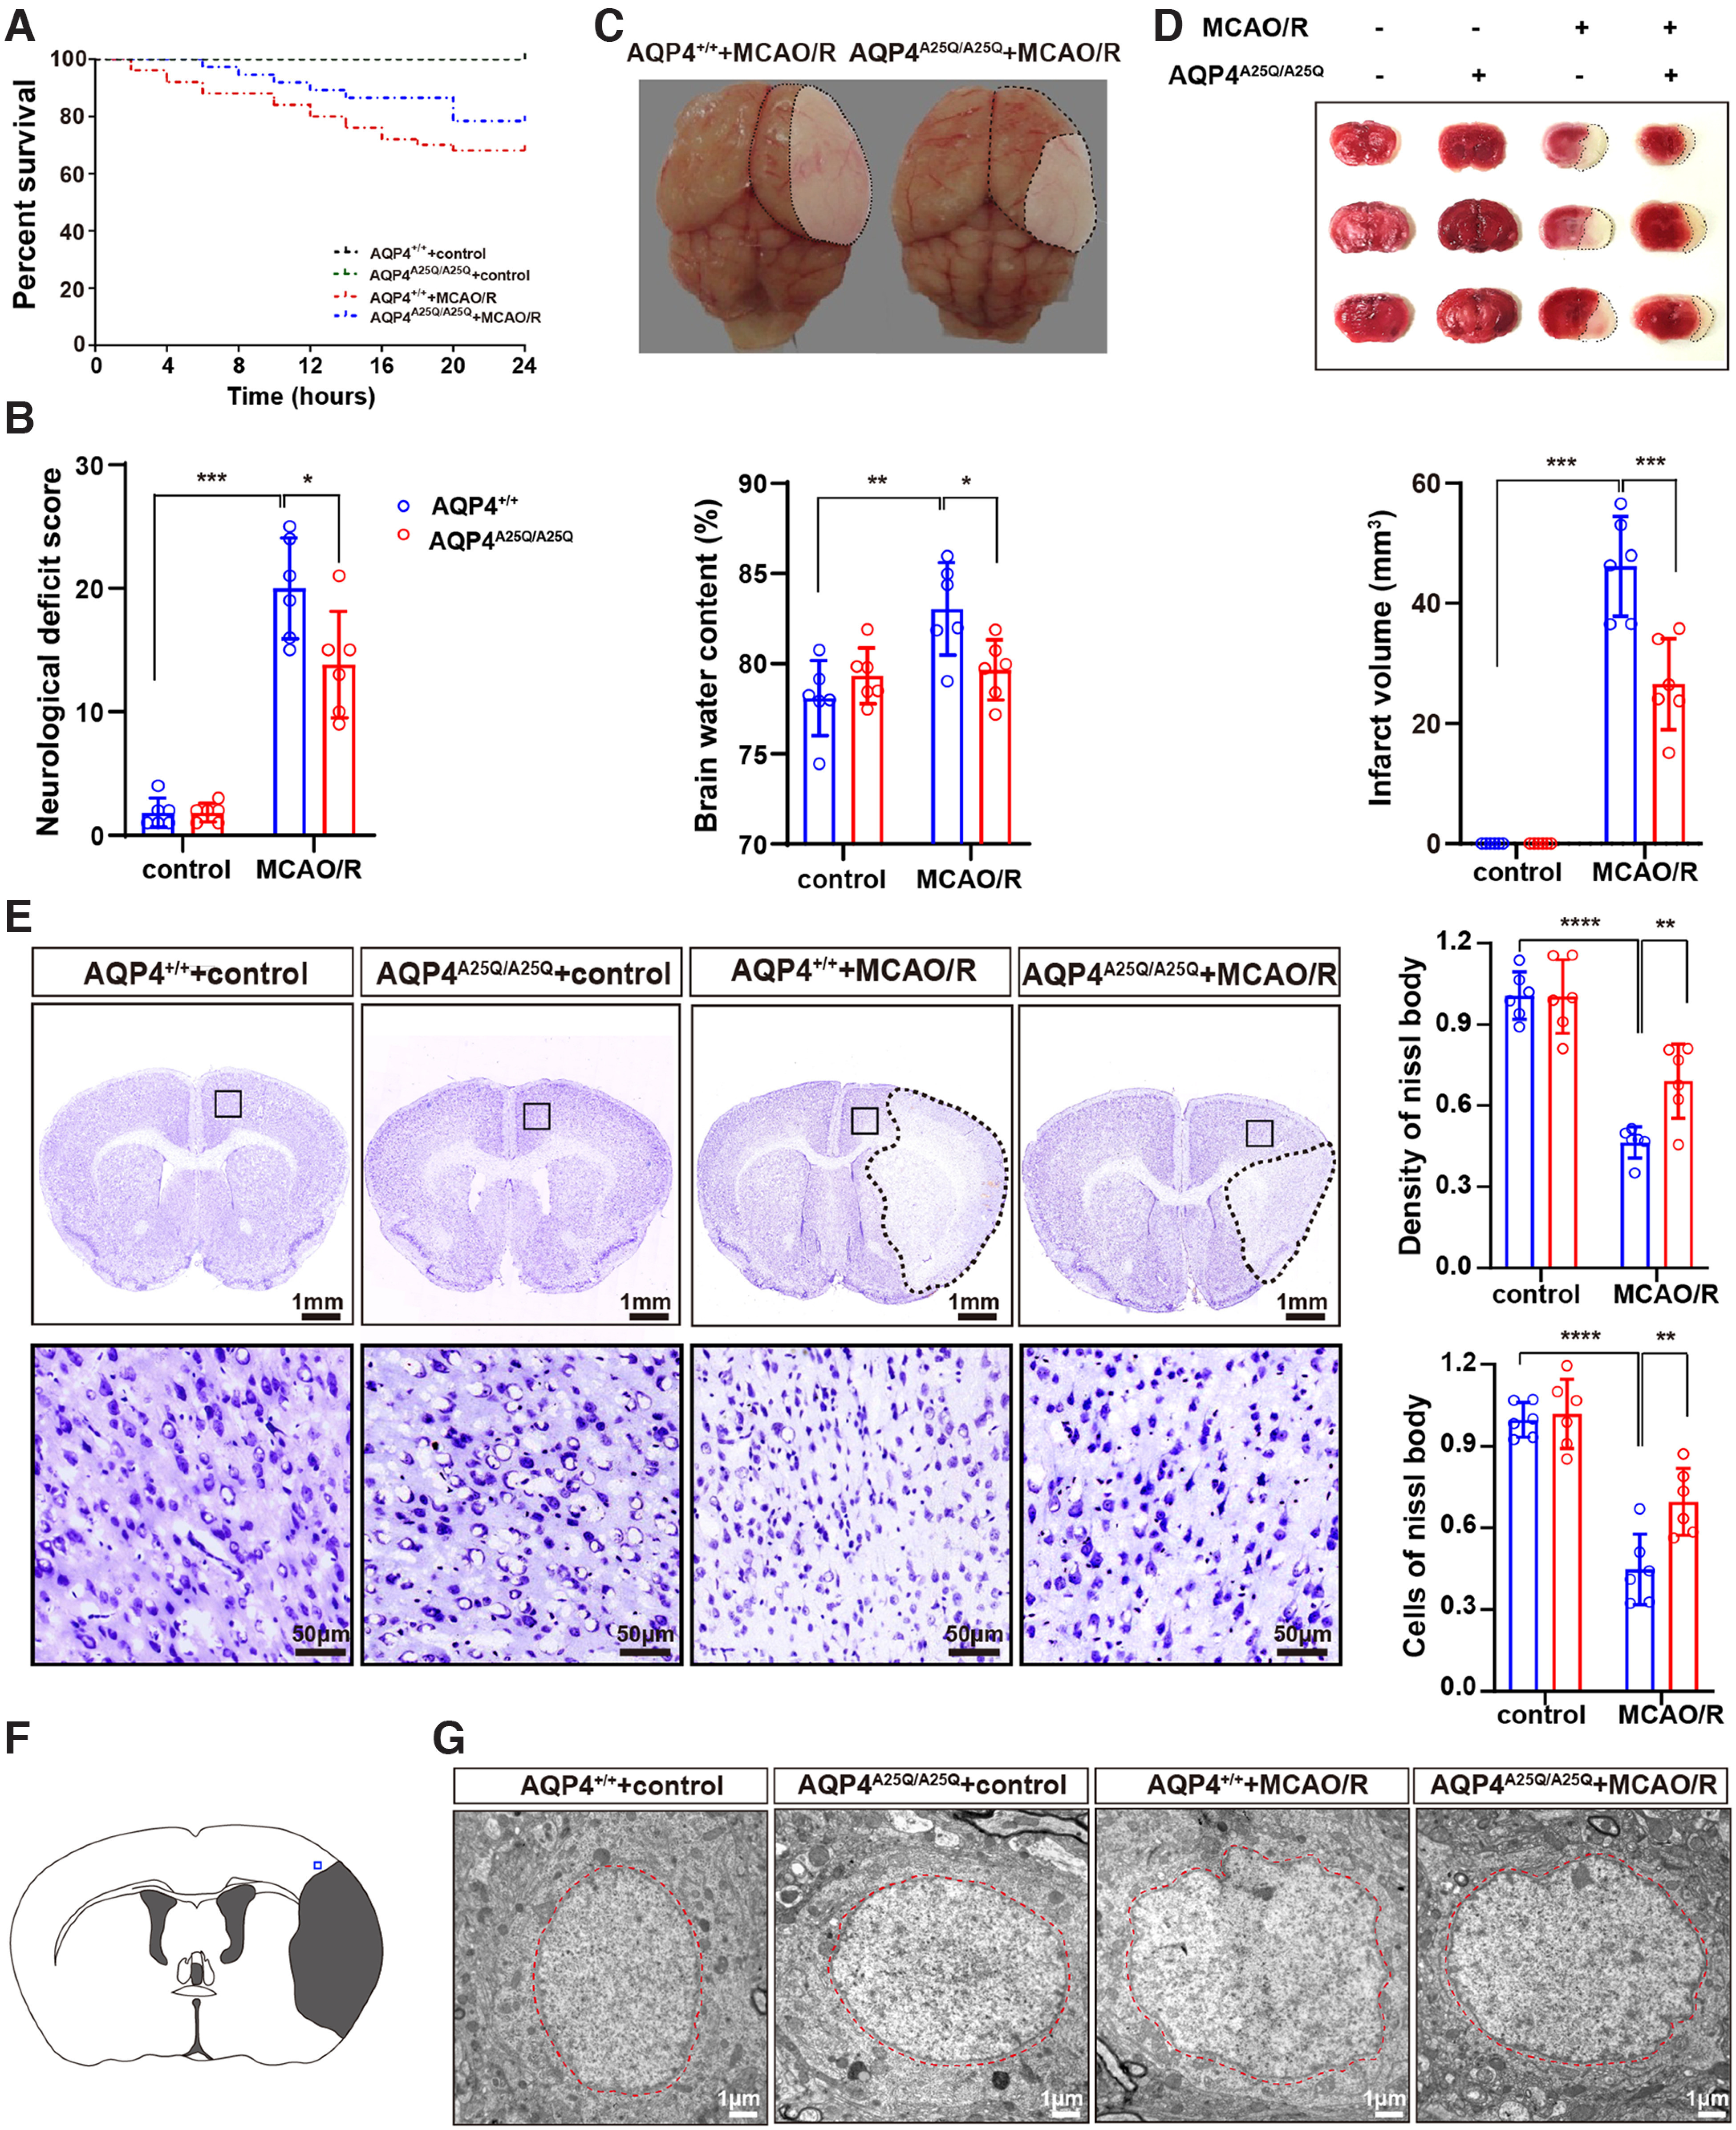
AQP4A25Q/A25Q mice exhibited improved brain edema, neurologic outcomes, and survival after MCAO/R. A, Cumulative survival in AQP4+/+ and AQP4A25Q/A25Q mice with and without MCAO/R; n = 24 mice for AQP4+/+ without MCAO/R, n = 50 mice for AQP4+/+ with MCAO/R, n = 24 mice for AQP4A25Q/A25Q without MCAO/R, and n = 37 for AQP4A25Q/A25Q mice with MCAO/R. Changes of CBF in mice with MCAO/R are provided in Extended Data Figure 6-1. B, Neurologic scores of AQP4+/+ and AQP4A25Q/A25Q mice with and without MCAO/R; n = 6 mice for each group. C, Representative photographs of brain edema in mice with MCAO/R. Quantitative analysis of brain water contents were determined in mice with and without MCAO/R; n = 6 mice for each group. D, Representative photographs of brain slices stained with TTC. Red tissue is healthy, and white tissue is infarcted. Quantitative analysis of infarct volume was performed in mice with and without MCAO/R; n = 6 mice for each group. E, Representative photographs of Nissl body staining of AQP4+/+ and AQP4A25Q/A25Q mice with and without MCAO/R. Scale bars: 1 mm, 50 μm. Quantitative analysis of the density and cells in Nissl body staining was performed; n = 6 mice for each group. F, Blue square represents the anatomic location of images in G in the ipsilateral peri-infarct regions. G, Representative electron microscope photographs of neuron nuclei in AQP4+/+ mice and AQP4A25Q/A25Q mice with and without MCAO/R. Scale bar, 1 μm. A, Log-rank (Mantel–Cox) test was used. B-D, Data are mean ± SD. *p < 0.05; **p < 0.01; ***p<0.001; ****p<0.0001; two-way ANOVA with Tukey's post hoc test.
