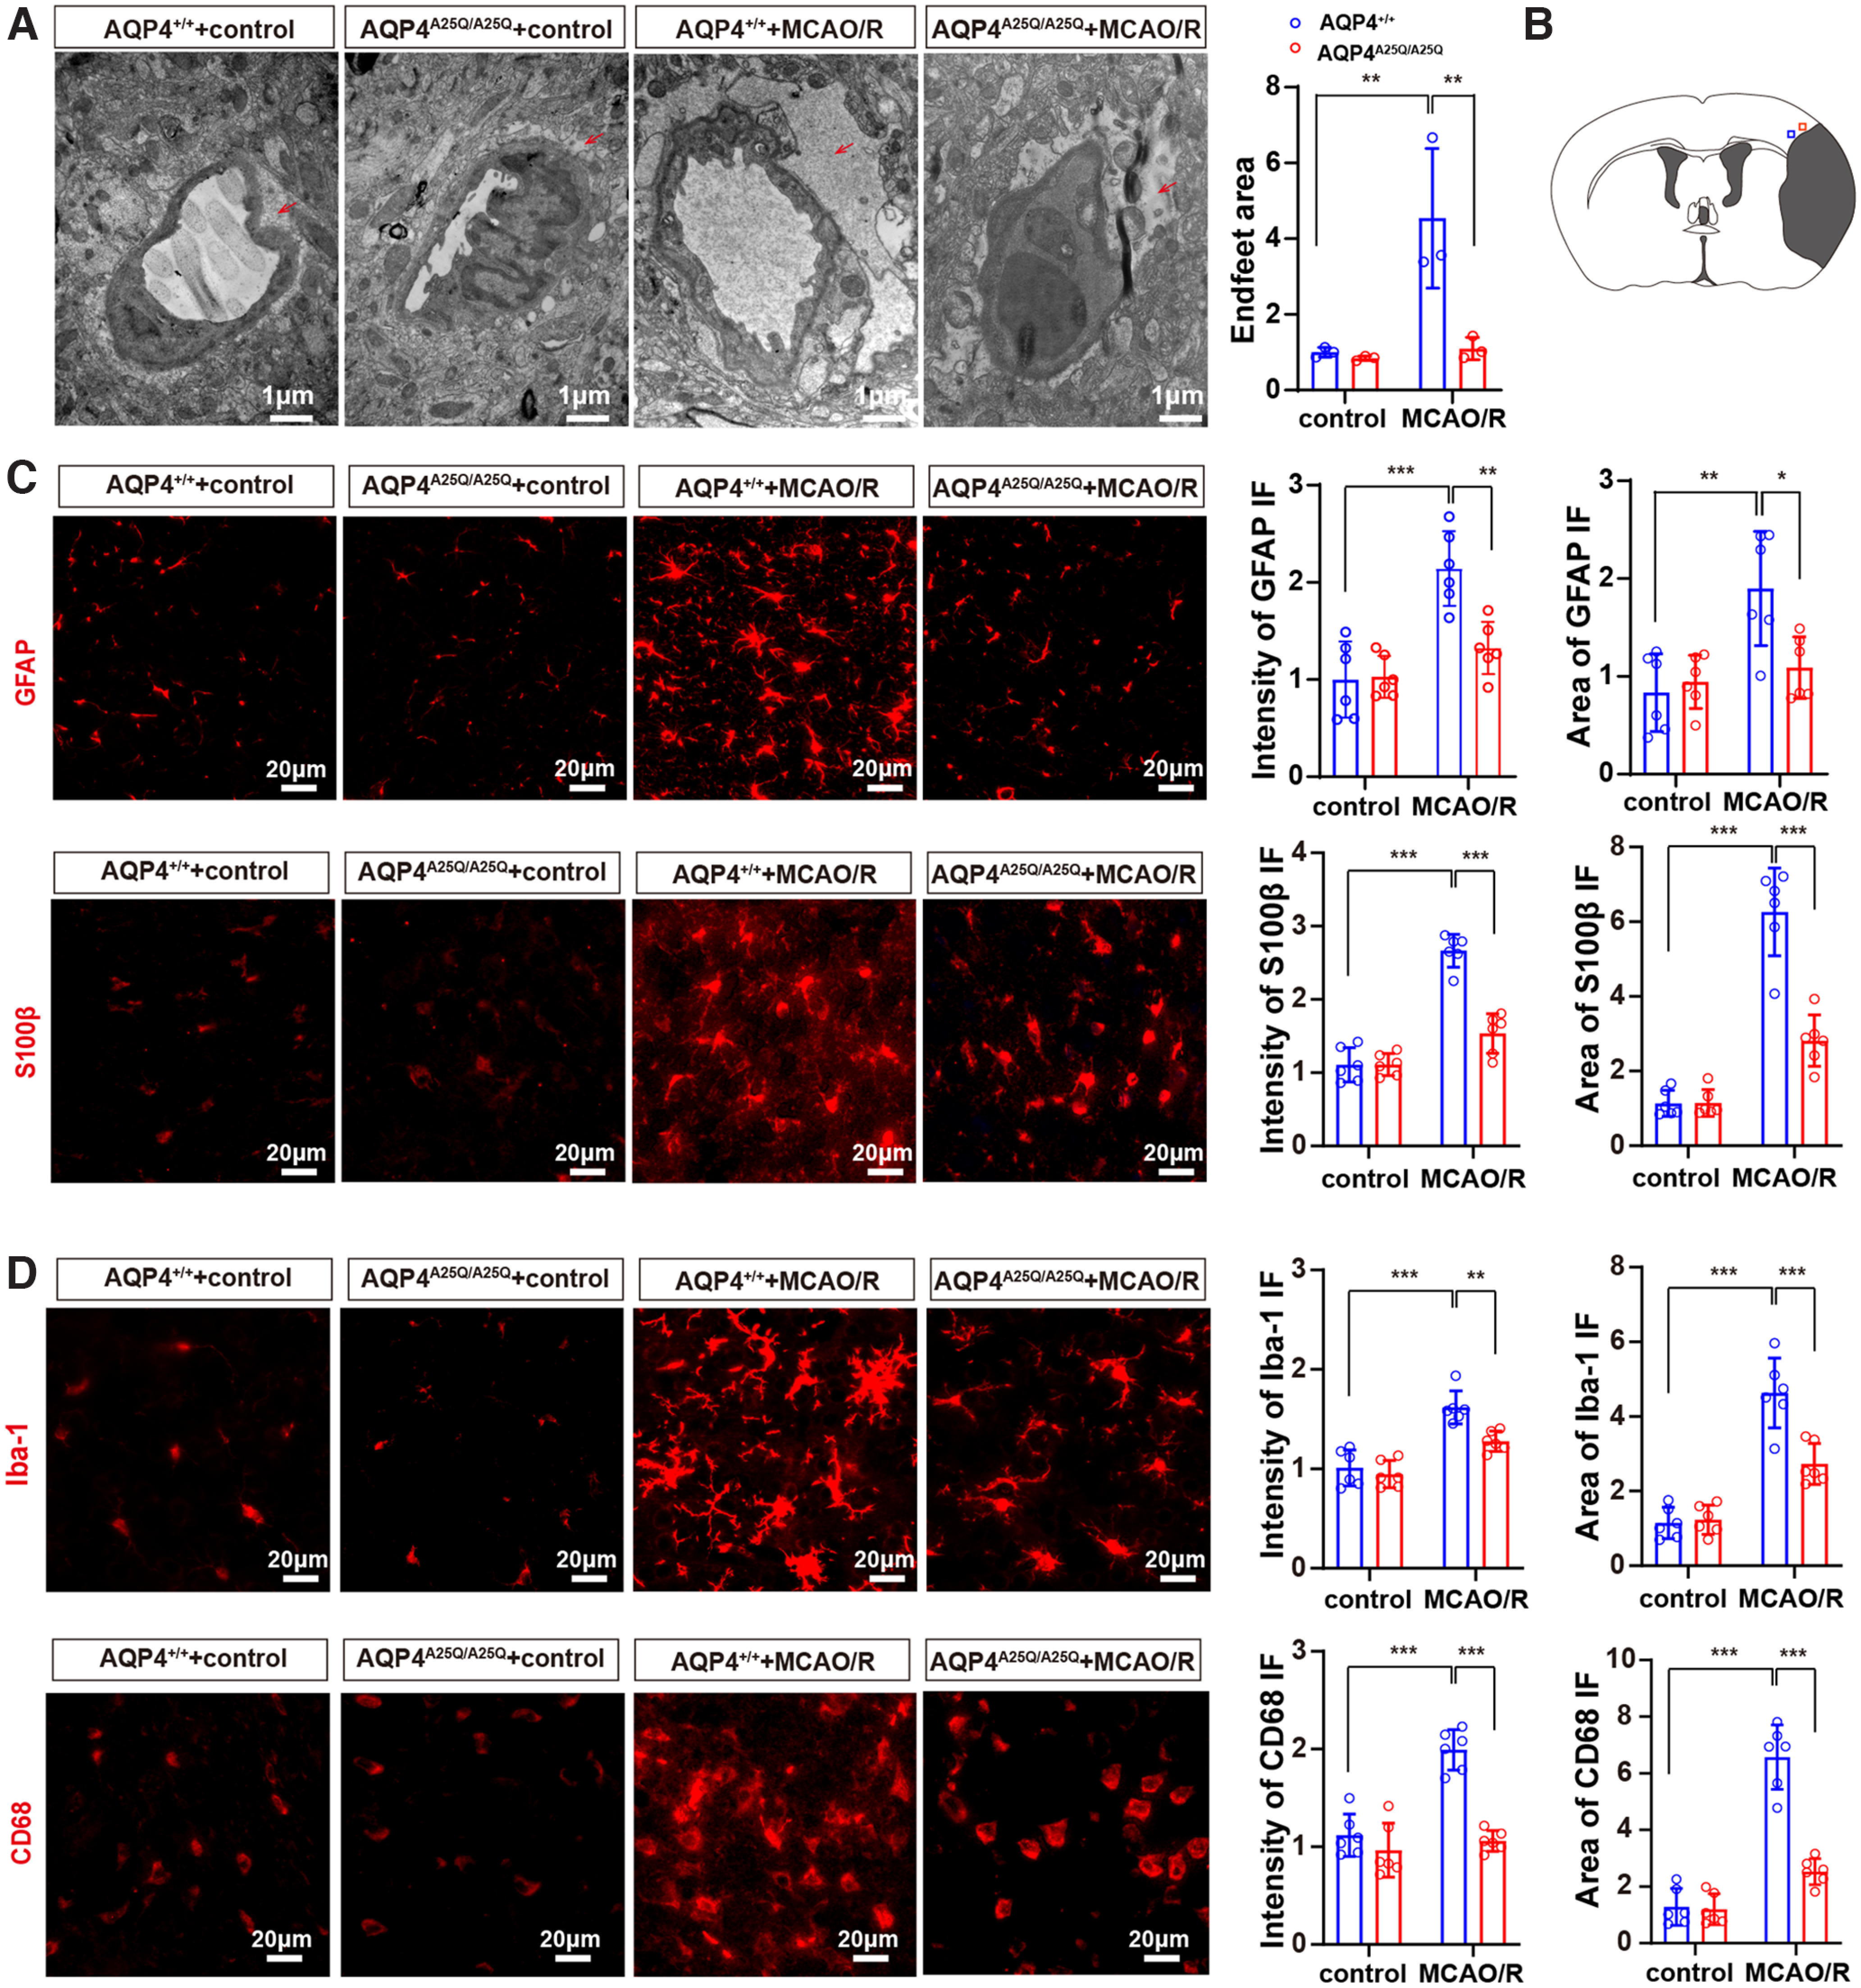
Figure 7.

AQP4A25Q/A25Q mice exhibited decreased swelling and activation of astrocytes after MCAO/R model. A, Transmission electron micrograph showing the edematous cerebral cortex at 24 h after MCAO/R. Scale bar, 1 μm. Quantification of the pericapillary astrocyte foot process area was performed with 3 fields/mouse; n = 3 mice. B, Blue square represents the anatomic location of images in C in the ipsilateral peri-infarct regions. Red square represents the anatomic location of images in D in the ipsilateral peri-infarct regions. A time course of astrocyte and microglia playing in the brain injury in MCAO/R model is provided in Extended Data Figure 7-1. C, Representative photographs of GFAP and S100β in astrocytes of AQP4+/+ and AQP4A25Q/A25Q mice with and without MCAO/R. The quantified intensity and area of GFAP and S100β in the brain; n = 6 mice for each group. Scale bar, 20 μm. Total number of GFAP-positive cells in control and mutant mice with MCAO/R are provided in Extended Data Figure 7-2. D, Representative photographs of Iba-1 and CD68 in microglia of AQP4+/+ and AQP4A25Q/A25Q mice with and without MCAO/R. The quantified intensity and area of Iba-1 and CD68 in the brain, n = 6 mice for each group. Scale bar, 20 μm. Data are mean ± SD. *p < 0.05; **p < 0.01; ***p<0.001; two-way ANOVA with Tukey's post hoc test. Antibodies used are provided in Extended Data Table 2-1.
