
Fig. 2.
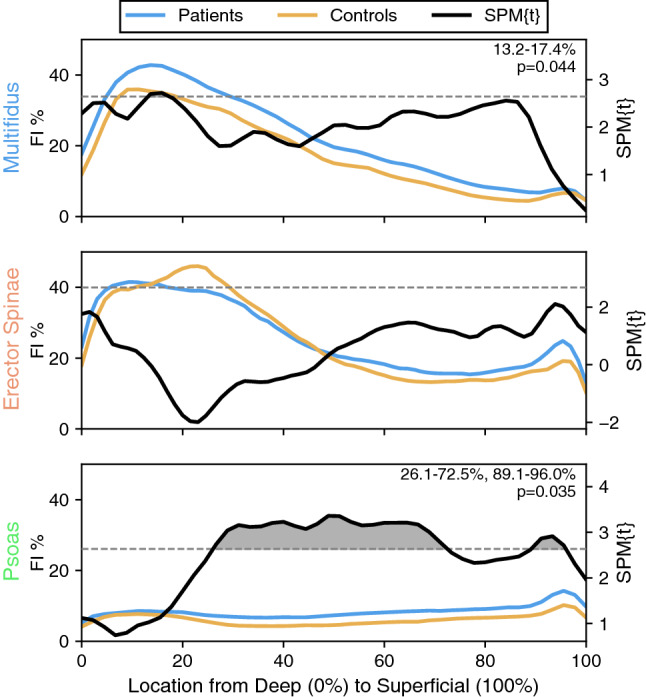
Differences in FI distribution patterns between cLBP patients and controls are muscle-specific and unique across PSMs Comparison of paraspinal muscle fat-maps between cLBP patients and controls using SPM t-tests reveal localized differences in FI in the deep multifidus (top) and in the intermediate to superficial psoas (bottom) but not in the erector spinae (middle). Although changes in the multifidus and the psoas FI distributions are associated with the presence of cLBP symptoms, the associated differences in FI are in separate regions of the muscle. Differences in FI were deemed significant between groups if the SPM{t} for a given region surpassed the critical threshold (dashed black line). Regions of significance (clusters) are shaded for visualization. The shaded area of a given cluster is associated with the strength of significance