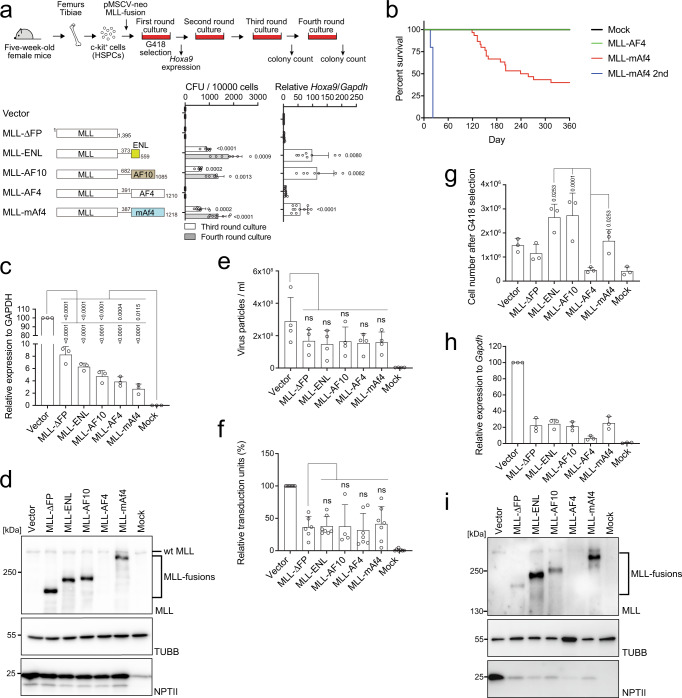
Fig. 1. MLL-AF4 translation is inhibited by post-transcriptional regulation.
a Colony-forming units (CFUs) of various MLL fusions per 10,000 cells at third- and fourth-round passages under myeloid conditions (n = 9: Vector, MLL-ΔFP, MLL-AF4, MLL-mAf4; n = 7: MLL-ENL; n = 6: MLL-AF10). Hoxa9 expression normalized to that of Gapdh of first round colonies is shown as the relative value of the vector control (set to 1) (n = 12, Vector, MLL-ΔFP, MLL-AF4, MLL-mAf4; n = 8: MLL-ENL; n = 7: MLL-AF10). b Leukemogenic potential of MLL-AF4 and MLL-mAf4 in vivo. Murine HSPCs were transduced with MLL-AF4 constructs and transplanted into syngeneic mice (mock, n = 6; MLL-AF4, n = 10; MLL-mAf4, n = 30; MLL-mAf4 secondary transplantation n = 5). c mRNA expression of the MLL fusion genes in 293 T cells analyzed using a qPCR probe for the EPS region in the pMSCV neo plasmids (n = 3). d Western blotting of MLL fusions in 293 T cells transfected with the MLL fusion expression vectors in c. Anti-beta tubulin (TUBB) (an internal standard) and neomycin phosphatase II (NPTII) antibodies (a gene transduction control) were included for comparison. e Virus particle production by the MLL fusion expression vectors was quantitated using qRT-PCR with the MSCV-EPS probe and absolute quantification methods (n = 4). f Transduction of recombinant viruses carrying various MLL fusion genes in murine HSPCs were determined using qPCR probes for MSCV-EPS and the murine Gapdh locus (n = 7: Vector, MLL-ENL, MLL-AF4, MLL-mAf4, Mock; n = 6: MLL-ΔFP; n = 4: MLL-AF10). g Cell numbers of murine HSPCs infected with various retroviruses carrying MLL fusion genes after 5 days of selection with G418 (n = 3). h Relative mRNA expression of MLL fusion genes after antibiotic selection using qRT-PCR with the MSCV-EPS probe (n = 3). i Western blotting of HSPCs transduced with retroviruses carrying MLL fusion genes cultured in G418 for 5 days, as shown in d. Data are presented as the mean ± SD of biologically independent replicates (a, c, e, f, g, h). P-value was calculated by one-way ANOVA followed by Tukey’s test (a, c, e, f, g). Western blotting was performed on two biological replicates (d, i). See also Supplementary Fig. 1. Source data are provided as a Source Data file.

