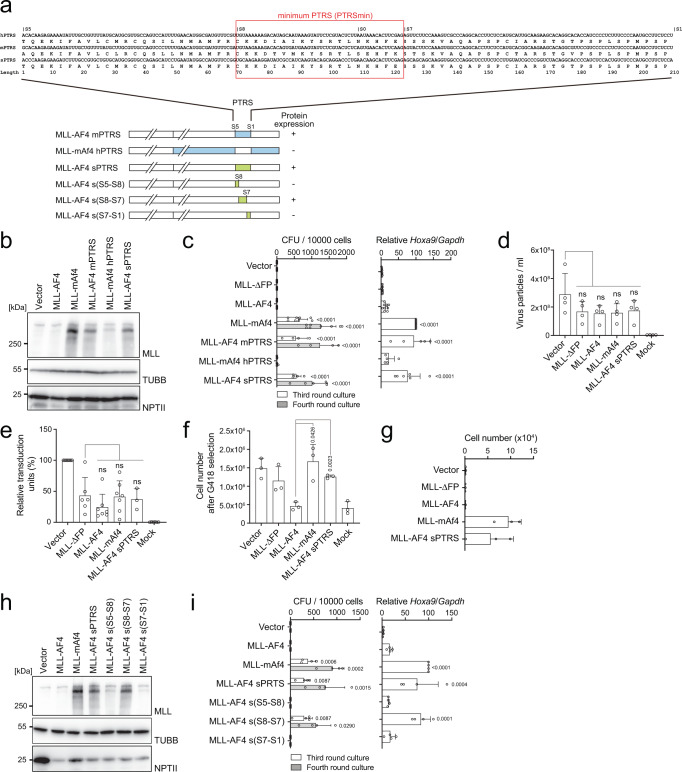
Fig. 2. The post-transcriptional regulatory sequence is responsible for MLL-AF4 translation.
a Domain swapping mutants of various MLL-AF4 mutants are shown in blue (mouse), white (human), and green (synonymous mutations). RNA and amino acid sequences of the post-transcriptional regulatory sequence (PTRS) of human AF4 (hPTRS) and its corresponding sequences of mouse AF4 (mPTRS) and the synonymous mutant (sPTRS). The minimum PTRS is indicated with a red rectangle. b Western blotting of MLL-AF4 mutants in 293 T cells, as described in Fig. 1d. c Transforming ability of MLL-AF4 mutants under myeloid conditions, as described in Fig. 1a (n = 8: Vector, MLL-ΔFP, MLL-AF4, MLL-mAf4; n = 5: MLL-AF4 sPTRS; n = 4: MLL-AF4 mPTRS, MLL-mAf4 hPTRS). Hoxa9 expression normalized to that of Gapdh of first round colonies is shown as the relative value of the MLL-mAf4 (set to 100) (n = 9, Vector, MLL-AF4, MLL-mAf4; n = 8: MLL-ΔFP; n = 6: MLL-AF4 sPTRS; n = 5: MLL-AF4 mPTRS, MLL-mAf4 hPTRS). d Virus particle production by the MLL-AF4 mutant expression vectors. Virus particle production was quantitated as described in Fig. 1e (n = 4). e Relative transduction units of retroviruses carrying various MLL-AF4 mutant genes in murine HSPCs were determined as described in Fig. 1f (n = 7, Vector, MLL-AF4, MLL-mAf4; n = 6: MLL-ΔFP, Mock; n = 3: MLL-AF4 sPTRS). f Cell numbers of MLL-AF4-transduced murine HSPCs after 5 days of G418 selection (n = 3). g Transforming ability of MLL-AF4 mutants under an ex vivo lymphoid culture condition. Cell numbers per 10,000 cells at the third passage is shown (n = 3). h Western blotting of the various MLL-AF4 synonymous mutants in 293 T cells, as described in Fig. 1d. i Transforming ability of various MLL-AF4 synonymous mutants under myeloid conditions. CFUs per 10,000 cells in third- and fourth-round culture is shown (n = 4). Hoxa9 expression normalized to Gapdh is shown as the relative value of MLL-mAF4 (set to 100) (n = 4). Data are presented as the mean ± SD of indicated biologically independent replicates (c, d, e, f, g, i P-value was calculated by one-way ANOVA followed by Tukey’s test (c, d, e, f, i). Western blotting was performed on two biological replicates (b, h). See also Supplementary Fig. 2. Source data are provided as a Source Data file.

