
Fig. 3. Membrane potential is important for gastrulation and regulates calcium levels at gastrulation onset.
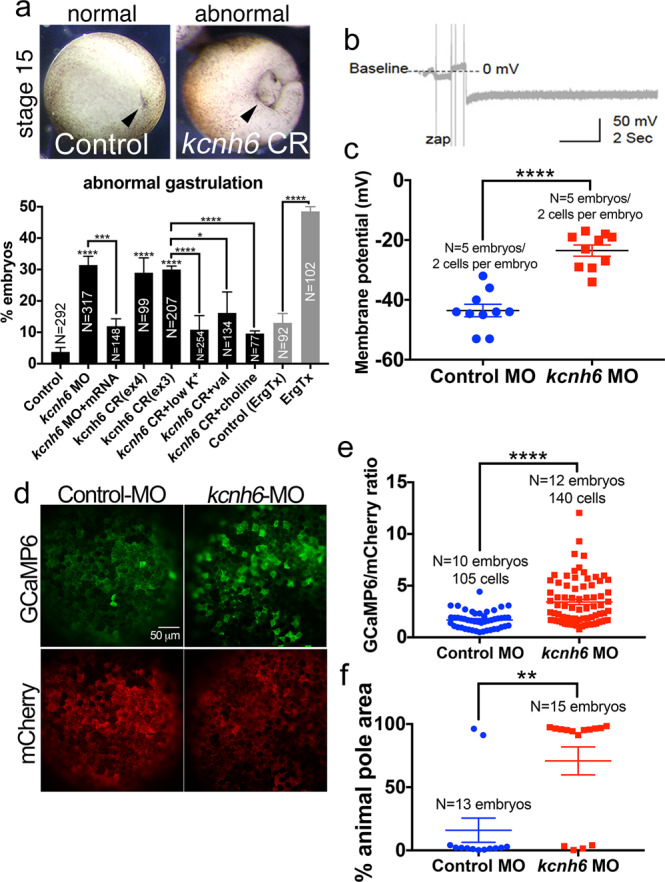
a Percentages of embryos with abnormal gastrulation after depletion of kcnh6 (MO, CRISPR) or Kcnh channel blockade with Ergtoxin, and rescue of kcnh6 depletion with medium conditions that hyperpolarize the Vm (low K+, val valinomycin, sodium substitution with choline; treatments performed stages 8–12). Above: examples of embryos scored for the graph; posterior views (dorsal to the top) of stage 15 embryos after successful (control) or unsuccessful (kcnh6 CRISPR = CR) gastrulation; arrowhead points to blastopore closure. Graph reports mean ± SEM; total embryo numbers (N) in the graph are from 3 independent experiments (except for Ergtoxin: 2 independent experiments with devitellinized embryos); p-values are (kcnh6MO vs Control MO) = 8.66e–010, (kcnh6MO+mRNA vs kcnh6MO) = 2.59e-004, (kcnh6CRex4 vs Control) = 7.19e-018, (kcnh6CRex3 vs Control) = 5.79e-022, (kcnh6CR+low K+ vs kcnh6CR) = 1.64e-005, (kcnh6CR+val vs kcnh6CR+DMSO) = 1.22e-002, (kcnh6CR+choline vs kcnh6CR) = 2.34e-006, (ErgTx vs Control) = 6.57e-010; two-sided Fisher’s exact test. b Representative intracellular recording in the prospective ectoderm of a control stage 10 embryo; Vm is measured relative to the medium (baseline); the dip in membrane potential indicates the electrode breaking into the cell. c The Vm as measured by intercellular recordings in the prospective ectoderm of stage 10 Control MO and kcnh6 MO-injected embryos; graph reports mean ± SEM; p-value (kcnh6MO vs Control MO) is 1.07e-006 (unpaired two-tailed student’s t-test); each data point represents one cell; data from 10 cells/5 embryos/3 independent experiments. d Live animal pole images of GCaMP6/mCherry at stage 10. e Quantification of GCaMP6 fluorescence intensity normalized to mCherry in mCherry+ cells; graph shows mean ± SEM; data points represent single cells; data from N cells (in graph)/10 embryos/3 independent experiments; p = 1.14e-006; unpaired two-tailed student’s t-test. f Maximum area undergoing simultaneous Ca2+ transients within a 20 s time lapse recording as a percentage of total animal pole area; the animal poles of 13 Control MO and 15 Kcnh6 MO embryos were recorded over 3 independent experiments; p = 1.04e-003; unpaired two-tailed student’s t-test. Key for asterisks: *p ≤ 0.05, **p ≤ 0.01, ***p ≤ 0.001, ****p ≤ 0.0001, ns nonsignificant with p > 0.05. Source data are provided as a Source Data file.